


 Account Settings
 Record List
 Alias List Editor
 Legacy sites
Search Results
1 / 292
COPE Catchment 1.0
T-2022-05-11-71fm9pfa2MEafB1HtIhSrpA
COPECatchmentCountry
Chile
COPECatchmentName
Estero Las Bayas
Lithology
Volcaniclastic rocks

2 / 292
COPE Research Site 1.0
T-2022-08-14-k15XufUVk2sk1Kk1LNh8hCJ9PA
VegetationMap
Several landcover classifications based on Landsat images from 1966 to 2018
3 / 292
Dataset 1.2
T-2024-01-29-G1fo5775EKUejG1ZPiKSdJbA
Abstract
Since the report of the RNA aptamer for theophylline, theophylline has become a key molecule in chemical biology for designing RNA switches and riboswitches. In addition, theophylline is an important drug for treating airway diseases including asthma. The classic RNA aptamer with excellent selectivity for theophylline has been used to design biosensors, although DNA aptamers are more desirable for stability and cost considerations. In this work, we selected DNA aptamers for theophylline, and all the top sequences shared the same binding motifs. Binding was confirmed using isothermal titration calorimetry and a nuclease digestion assay, showing a dissociation constant (Kd) around 0.5 μM theophylline. The Theo2201 aptamer can be truncated down to 23-mer while still has a Kd of 9.8 μM. The selectivity for theophylline over caffeine is around 250,000-fold based on a strand-displacement assay, which was more than 20-fold higher compared to the classic RNA aptamer. For other tested analogs, ...
DatasetTitle
A DNA Aptamer for Theophylline with Ultrahigh Selectivity Reminiscent of the Classic RNA Aptamer
4 / 292
Dataset 1.2
T-2022-03-16-41cLEl0SpRUCegOAhDvB6jA
Abstract
This dataset provides two 30-m resolution time series products of annual land cover classifications over the Arctic Boreal Vulnerability Experiment (ABoVE) core domain for each year of the period 1984-2014. The data are the annual dominant plant functional type in a given 30-m pixel derived from Landsat surface reflectance, landcover training data mapped across the ABoVE domain (using Random Forests modeling, with clustering and interpretation of field photography) and very high resolution imagery to assign land cover classifications. One product has a 15-class land cover classification that breaks out forest and shrub types into several additional classes; the other product provides a simplified, 10-class approach. Classification accuracy assessment results are provided per year. Assessments were based on a probability-based random sample of reference data that supported statistically robust estimation of areas and uncertainties in mapped areas.
Purpose
This data was collected to understand annual land cover classifications over the Arctic Boreal Vulnerability Experiment (ABoVE) core domain for each year of the period 1984-2014.
5 / 292
Dataset 1.2
T-2022-02-22-g1i4hH61sm02cSeCItbjAQg1
Abstract
This dataset is a synthesis of field plot characterization data, derived above-ground and below-ground combusted carbon, and acquired Fire Weather Index (FWI) System components for burned boreal forest sites across Alaska, USA, the Northwest Territories, and Saskatchewan, Canada from 1983-2016. Unburned plot data are also included. Compiled plot-level characterization data include stand age, disturbance history, tree density, and tree biophysical measurements for calculation of the above-ground (ag) and below-ground (bg) biomass/carbon pools, pre-fire and residual post-fire soil organic layer (SOL) depths and estimates of combustion of tree structural classes. The measured slope and aspect for each site and an assigned moisture class based on topography are also provided. Data from 1019 burned and 152 unburned sites are included. From the estimates of combusted ag and bg carbon pools and SOL losses, the total carbon combusted, the proportion of pre-fire carbon combusted, and the propor ...
Purpose
This data was collected to provide a synthesis of field plot characterization data, derived above-ground and below-ground combusted carbon, and acquired Fire Weather Index (FWI) System components for burned boreal forest sites across Alaska, USA, the Northwest Territories, and Saskatchewan, Canada from 1983-2016.
6 / 292
Dataset 1.2
T-2021-12-02-v11L6TcXmhE2ONYzKv3ckXAA
DataLineage
1. Description of methods used for collection/generation of data:
A. Soil Landscapes of Canada (SLC) Data Version 2.2 (Centre for Land and Biological Resources Research, Agriculture and Agri-Food Canada, 1996): This dataset was published in Dec 1996 by Agriculture and Agri-Food Canada based on soil survey mapping done over the years and updated regularly. The data has a resolution of 1:1 million and covers entire Canada. The dataset is structured as below:
a. It divides whole of Canada into several ecodistricts which have been made available as a polygon shapefile where each polygon corresponds to an ecodistrict.
b. Each polygon is further divided into a number of soil texture components.
c. The percentage area covered by the components in an ecodistrict are given in tables but their locations are not known i.e. there is no shapefile defining coverage of each component inside of each ecodistrict.
d. Each of these components have been allocated a soil type: CL - clay loam, KCL ...
7 / 292
Dataset 1.2
T-2020-05-28-i19UjL25zw02h043LQu04Og
Abstract
Data was collected using autonomous recording units (ARU), and in-person point count surveys, during the 2018 field season. Variables such as: dominant vegetation cover, area of peatland, elevation, Natural Subregion classification, distance to closest road, ambient noise, wind speed, date and time of year, were collected along with the point counts and recorded files. Spectrograms were used to analyze recorded files since each bird species have unique songs and calls. Once files were processed a list of bird species present at each site was used for statistical analysis. This data collection method will also be repeated for the 2019 field season.
Purpose
The objectives of this project is to determine the bird species richness in mountain peatlands along an elevation gradient in the Upper Bow River Basin, and model how community composition changes along an elevation gradient. The purpose of this study is to understand what birds occupy mountain peatlands, and studying birds along an elevation gradient can be a proxy for how species richness and community composition will change with the changing climate. Also, bird watching is a very popular economic activity and this taxonomic group is a great motivator for those who care about habitat protection, but before we can protect birds in mountain peatlands, we need to know: what species are there, the number of species, and what influences their presence.
This data set is collected for the project titled “Future Water for the Mountain West" [now Mountain Water Futures], which is a Pillar 3 project under the Global Water Futures Program funded by Canada First Research Excellence Fund.
8 / 292
Dataset 1.2
T-2022-02-15-81HHp7sSjmU2581Oi5gQzJug
Abstract
Data was collected from three rivers in the Greater Toronto Area of Southern Ontario: Ganatsekiagon Creek (City of Pickering), Wilket Creek (City of Toronto), and Morningside Creek (City of Toronto). The grain size distribution at each site was calculated using a Wolman Pebble count with a 200-stone sample size. Bedload transport was monitored over three years using Radio Frequency Identification (RFID) tracer stones, and periodic topographic surveys were conducted. A total of 300 tracers in 3 size classes were seeded in each site in August 2015. Tracer positions were recorded after each major rainfall event during the active field season each year, resulting in a total of 10, 12, and 13 recoveries in Ganatsekiagon Creek, Wilket Creek, and Morningside Creek, respectively. With each recovery, the travel distance of each tracer since its last known position is calculated. Detailed topographic surveys of the channel bed were conducted in the summers of 2016 and 2018 using a total station. ...
Purpose
Watershed urbanization and stormwater management (SWM) alter the hydrologic and geomorphologic processes of rivers. This purpose of this study is to characterize the bedload sediment transport regime of semi-alluvial gravel-bed rivers, and how it is affected by watershed urbanization and common SWM strategies. This project monitors the movement of coarse sediment and morphological change of three rivers in the Greater Toronto Area of Southern Ontario: Ganatsekiagon Creek (City of Pickering), Wilket Creek (City of Toronto), and Morningside Creek (City of Toronto). This study presents a means of monitoring bedload transport processes in restored rivers, and results can inform future river restoration designs.
Funding for this data collection was provided by an NSERC Strategic Grant (STPGP 463321-14, Assessing and restoring the resilience of urban stream networks). This data collected will also be used to support the project titled "Linking Stream Network Process Models to Robust Data Ma ...
9 / 292
Dataset 1.2
T-2020-07-22-b1DGfml5b220WMMsb21vRwK0A
Abstract
Shapefile detailing classified prairie watersheds (n = 4175) according to physiographic characteristics. These characteristics were assembled from a variety of sources, including remote sensed data and government databases. Variables included climatic (annual precipitation, potential evapotranspiration), physical (slope, elevation), surficial geology, wetland (density, size distribution), and land cover/use data. Watersheds were classified using a hierarchical clustering on principal components analysis. As a result, seven distinct classes of watersheds were identified. The dataset defines two classifications schemes: (1) Integrated Watershed Classification, and (2) Land Cover Watershed Classification. The schemes differ as the latter was performed without climatic variables. As such, the land cover approach is suited for applications where local climate is forced using other data sources (e.g., hydrological modelling). The integrated classification is suited for general applications. ...
Citations
Wolfe, J., Whitfield, C. J., Shook, K. R., Spence, C. (2019). Canadian Prairie Watershed Classification [Dataset]. Federated Research Data Repository. https://doi.org/10.20383/101.0197
DatasetTitle
Canadian Prairie Watershed Classification
Keywords
Prairies watershed classification geography
Purpose
Develop a systematic classification of Prairie watersheds based on similar geographic characteristics. The classification serves as a foundation for virtual watershed modelling within the project to investigate how watershed hydrology and biogeochemistry respond to environmental change.
10 / 292
Dataset 1.2
T-2020-11-25-w1QppA687F0a2w1fGEoxzzNw1
CreationSoftware
MESH 1.4 CLASS 3.6
DataLineage
Model name: Coupled hydrology land-surface model (MESH), using the Canadian Land Surface Scheme (CLASS)
Model version number: MESH (1.4) using CLASS (3.6)
Model source/webpage: https://wiki.usask.ca/pages/viewpage.action?pageId=220332269
Model output pre-processing script: TBA. Scripts will be shared on github.
Model output post-processing script: TBA. Scripts will be shared on github.
Model setup: Physically based with no calibration.
Time step: Hourly
Initial condition: Physically based, set based on the understanding of the hydrological system
Boundary condition: Physically based, set based on the understanding of the hydrological system
Keywords
surface radiative and turbulent fluxes snow energetics snow hydrology alpine hydrology glacier energetics and hydrology diagnostic variables MESH CLASS Canadian Rockies
Purpose
Evaluate the coupled hydrology land-surface model (MESH), using the Canadian Land Surface Scheme (CLASS) at different alpine and glacierized research sites in the Canadian Rockies.
Summary
Snow and ice processes in high mountain environments are controlled by precipitation, blowing snow redistribution, sublimation, and the exchange of radiative and turbulent fluxes. Snow interception in forests is important in many alpine regions. The current dataset is the collection of simulated data at different alpine and glacierized research sites in the Canadian Rockies (e.g. alpine ridges, glacier, alpine forests and clear cuts, and montane sites). The coupled hydrology land-surface model (MESH), using the Canadian Land Surface Scheme (CLASS), is run using a physically based modeling approach based on the understanding of the hydrological system. For the different sites, the model was run in single column mode and forced by 30-min meteorological observations collected as part of the Canadian Rockies Hydrological Observatory. The forcing data of shortwave and longwave irradiance were adjusted to slopes; meanwhile, air temperature, humidity, pressure and precipitation were adjusted ...
11 / 292
Dataset 1.2
T-2021-12-02-y1x1BdxcDjU2pcHZ8tEEEiQ
Abstract
Land surface schemes can be applied to simulate evapotranspiration. This dataset contains the driving meteorological data, and various diagnostic data, from one of the Boreal Ecosystem Research and Monitoring Sites in central Saskatchewan, known as the Old Jack Pine site. In Nazarbakhsh et al. (2019, Hydrological Processes, https://doi.org/10.1002/hyp.13674) we used these data to drive two Canadian land surface schemes (CLASS and CLASS–CTEM). We used half–hourly values of shortwave radiation, longwave radiation, precipitation, air temperature, specific humidity, wind speed, and atmospheric pressure to drive the models. Flux tower estimates of evapotranspiration, with energy balance closure applied, were used to assess the performance of the models on daily and monthly timescales for years 2000 to 2010. We also used soil moisture (measured with Campbell Scientific CS615 probes, which measure liquid water content only) and soil temperature observations for years 2000 to 2010 to assess th ...
Keywords
boreal forest BERMS Old Jack Pine site evapotranspiration land surface schemes CLASS CLASS-CTEM
12 / 292
Dataset 1.2
T-2020-05-28-q1YVA91QIL0Oco4TsyHfmgA
Abstract
Global climate change has had a significant effect on the permafrost landscape in Northern cold regions. Due to natural processes such as precipitation change and rising temperatures, in addition to anthropogenic intervention, we notice a steadily increasing, and systemic pattern of permafrost thaw. The fieldwork took place in the Sahtu region of the Northwest Territories, specifically within the Bogg Creek Watershed, located 30 kilometers South of the Town of Norman Wells. Our work seeks to use two geophysical methods, electrical resistivity tomography (ERT) and electromagnetic induction (EMI) to estimate the permafrost table depth in areas with local landscape features such as lakes and clear cuts. The purpose of this research is also to benchmark a non-ground coupled system (EMI) against the more classical ground-coupled methods (ERT). The ERT system we used is the Syscal Junior 48, and the EMI system was the Geonics Inc EM-31 and EM-34. The field mission lasted four days, and we co ...
Purpose
Northern cold regions are especially susceptible to climatic variations, and as a result of global climate change, it is important to understand the permafrost distribution using more efficient methods. Surficial alterations, both natural and anthropogenic, can be indicators of permafrost degradation. The objectives of this research are to execute the geophysical surveys using electrical resistivity tomography (ERT) and electromagnetic induction (EMI) to detect changes in permafrost table depth and to assess the efficiency of the EMI method versus ERT method within the Sahtu Region in the Northwest Territories.
This data set will also support the objectives of projects titled Transformative sensor Technologies and Smart Watersheds (TTWS) and the Northern Water Futures (NWF). These projects are Pillar 3 projects under the Global Water Futures Program funded by Canada First Research Excellence Fund.
13 / 292
Dataset 1.2
T-2021-03-15-C15sibC10qjEKgqIhEm9LC34g
Abstract
MESH model is used for calibration/ validation of the streamflow. MESH is a physics-based, land-surface hydro- logical modelling system developed by Environment and Climate Change Canada. MESH performs both water and energy balances and is best suited to cold-region, large-scale catchments due to its ability to simulate snow processes, such as snow accumulation, redistribution, and melt. MESH is used to simulate important hydrological processes (like runoff generation, evapotranspiration, and soil moisture).
SED model is a physically based watershed sediment transport model which is developed based on empirical equations and the sediment mass balance equation (for overland and instream flow). It includes different sediment classes and is suitable for large scale cold regions catchments. The model simulates hourly sediment load and concentration.
The following input data were used for hydrological modelling:
- Meteorological data: For model calibration and validation, seven forcin ...
Purpose
For Core Modelling, this data is generated under the water quality theme which aims to perform sediment yield and transport for cold region catchment. A sediment transport model will be integrated with the existing MESH model. The MESH model is a hydrological model and does not incorporate water quality components. The new sediment transport model will use the hydrological output from MESH to simulate sediment load and transport. Further, a nutrient transport component will be added to the model in future.
14 / 292
Dataset 1.2
T-2020-11-25-k1htBLtR8Ok1k2GmoFSlBlCyw
Abstract
Most of the data are available free for analysis in the Fraser Basin. The analysis procedure is applied on different data types, including point (e.g., streamflow records), vector (e.g., river network), and raster images (e.g., DEM) as inputs for the setup of the MESH model in the Fraser Basin. Different processing steps can be applied over input datasets, such as clipping, merging, filtering, mosaicking.
The input data are as follows:
1) Basin, subbasin, subsubbasin boundary shapefiles
2) River networks
3) Streamflow records
4) Digital Elevation Model (DEM)
5) Land Cover Classes
6) Meteorological forcing
7) Soil Dataset
Purpose
One of the priority tasks in the Current Generation Hydrologic Modelling (CGHM) theme of the GWF Core Modelling and Forecasting Team is producing climate change runs for major basins across Canada. Part of this work plan is to set-up and run the climate change production runs for the Fraser River.
15 / 292
Dataset 1.2
T-2022-03-15-K10zyUHrTzkGHXG4qOBaCpQ
Abstract
Data collected for this project include a series of surface and subsurface variables characterizing the thermal and mass balance of observation points and the study basin as a whole. This includes both continuous (30 minute intervals) and discrete data sets collected between 2017-07-10 and 2019-09-10. Each data set was stratified across a series of land cover classes designated within the study basin: open water, mineral-cored uplands, riparian, ice-rich permafrost, and thermokarst features.
Surface variables measured continuously include stream discharge, albedo, air temperature, relative humidity, net radiation, and rain. Surface variables measured discretely include snow depth, snow density, vegetation height, and vegetation density.
Subsurface variables measured continuously include soil temperature, volumetric moisture content, and water table depth. Subsurface variables measured discretely include evapotranspiration rates, groundwater pressure head, and near surface soil thermal ...
DatasetTitle
Investigation of alpine land cover classes and their influence on basin water balance in the Mackenzie Mountains, Northwest Territories
Purpose
This data was collected to investigate alpine land cover classes and their influence on basin water balance in the Mackenzie Mountains, Northwest Territories.
16 / 292
Dataset 1.2
T-2021-02-12-M1YZJzKrNlkGt5eM2Dta5Scg
Abstract
The Parsivel is an optical disdrometer that measures the velocity and size of falling hydrometeors with the goal of classifying hydrometeor type and retrieve precipitation Particle Size Distribution (PSD). We use an OTT Parsivel² laser-optical disdrometer that functions with two sensor heads facing each other. One head is a transmitter that emits radiation (at 650 nm wavelength at the red band) in a horizontal plane and the other head is a receiver that senses how much of that radiation is received. The instrument measures the size of the hydrometeor by measuring the length of radiation that is blocked by the particle diameter. The velocity of the hydrometeor is estimated based on the time that a particular hydrometeor is blocking the radiation between the transmitter and receiver. The OTT Parsivel² retrieves particle velocity and size every minute, with a range in velocity from 0.2 to 20 m/s and a range in particle diameter from 0.2 to 25 mm (OTT Hydromet GmbH, 2018).
OTT Hydromet Gm ...
Purpose
This data was collected to support the GWF project "Mountain Water Futures".
VariableList
intensity of precipitation mm/h 1 min Parsivel precipitation since start mm 1 min Parsivel weather code SYNOP WaWa 1 min Parsivel weather code METAR/SPECI 1 min Parsivel weather code NWS 1 min Parsivel radar reflectivity dBz 1 min Parsivel (simulated by Parsivel software) MOR Visibility m 1 min Parsivel signal amplitude of laserband 1 min Parsivel number of detected particles 1 min Parsivel temperature in sensor °C 1 min Parsivel heating current A 1 min Parsivel sensor voltage V 1 min Parsivel kinetic energy J/(m2h) 1 min Parsivel snow intensity mm/h 1 min Parsivel size and speed spectrum number of particles per class 1 min Parsivel (spectrum for 32 classes of particle size and 32 classes of speed)
17 / 292
Dataset 1.2
T-2020-11-30-e1P73BXqCkkuGwJHQUWW0MA
Purpose
Prairie Water is an interdisciplinary project that prioritizes research to address pressing water security challenges and knowledge gaps in order to enhance the resilience of prairie communities. The project’s objectives and research plans are informed by working with partners from governments, communities, non-profit organisations, and industry groups.
The dataset contributes to work package 3.2, B(iii) under Phase II of Prairie Water, and contributes to the objective of identifying the geographical distribution of pesticide contamination in wetlands, key drivers of contamination and transport, and priority areas based on highest proposed risk of exposure.
VariableList
173 pesticide concentrations ug/L Spring/Summer Ca, CO3, Cl, F, Fe, Mg, Mn mg/L Spring/Summer conductivity us/cm Spring/Summer pH mg/L Spring/Summer nitrate dissolved mg/L Spring/Summer phosphorus – ortho & total mg/L Spring/Summer hardness, alkalinity mg/L Spring/Summer total dissolved solids mg/L Spring/Summer total nitrogen mg/L Spring/Summer ammonia-N mg/L Spring/Summer total organic carbon mg/L Spring/Summer wetland class classification Spring/Summer wetland vegetation percent Spring/Summer cyanobacteria bloom yes/no Spring/Summer Wetland area m2 Spring/Summer aquatic invertebrates abundance Spring/Summer waterfowl abundance Spring/Summer pesticide toxicity ug/L Collected from literature
18 / 292
Dataset 1.2
T-2020-11-23-d12iveo3nl0SU34Iq6XVhTA
Purpose
Prairie Water is an interdisciplinary project that prioritizes research to address pressing water security challenges and knowledge gaps in order to enhance the resilience of prairie communities. The project?s objectives and research plans are informed by working with partners from governments, communities, non-profit organisations, and industry groups.
The dataset contributes to work package 3.1, B(ii) under Phase II of Prairie Water, and contributes to the objective of understanding broad spatial patterns of nitrogen, phosphorus, and other chemical parameters across pothole wetlands in the Canadian Prairies.
VariableList
permanence class Category Annual cover class Category Annual pH dimensionless Spring/summer YSI sonde conductivity us/cm Spring/summer YSI sonde alkalinity mg/L CaCO3 Spring/summer YSI sonde total nitrogen mg/L Spring/summer SmartChem analyzer 170 nitrate mg/L Spring/summer SmartChem analyzer 170 ammonia-N mg/L Spring/summer SmartChem analyzer 170 total phosphorus mg/L Spring/summer SmartChem analyzer 170 total dissolved phosphorus mg/L Spring/summer SmartChem analyzer 170 soluble reactive phosphorus mg/L Spring/summer SmartChem analyzer 170 sulfate mg/L Spring/summer SmartChem analyzer 170 Chlorophyll a ug/L Spring/summer Spectrometer
19 / 292
Dataset 1.2
T-2021-02-08-G1HqQ2msDjEqymveNka1Faw
Abstract
A high resolution, enhanced version of Environment and Climate Change Canada’s MESH (Modélisation Environnementale Communautaire - Surface Hydrology) land surface hydrological model was set up at a spatial resolution of approximately 4 km by 4 km to correspond to the resolution of dynamically downscaled Weather Research Forecast (WRF) atmospheric model outputs for current and future climates in the region. This convection-permitting WRF product used ERA-Interim reanalysis product boundary conditions over 2000 - 2015 to produce realistic, high resolution weather simulations. The pseudo global warming (PGW) approach to dynamical downscaling of future warming projection under RCP8.5 (2086 - 2100), used WRF bounded by ERA-Interim outputs that were perturbed by the mean outcomes of an ensemble of Coupled Model Intercomparison Project Phase 5 (CMIP5) climate model projections.
Available land surface data consist of digital elevation models (DEMs), i.e. the hydrologically conditioned HydroSh ...
Purpose
Project Title: Diagnosis of Historical and Future Flow Regimes of the Bow River at Calgary using a Dynamically Downscaled Climate Model and a Physically Based Land Surface Hydrological Model
The project assesses the impacts of projected climate change on the hydrology, including the flood frequencies, of the Bow and Elbow Rivers above Calgary, Alberta. It reports on investigations of the effects of projected climate change on the runoff mechanisms for the Bow and Elbow River basins, which are important mountain headwaters in Alberta, Canada. The study developed a methodology and applied a case study for incorporating climate change into flood frequency estimates that can be applied to a variety of river basins across Canada. It also produced model simulated future streamflow for Bow and Elbow River basins above Calgary. The project was carried out by scientists from the University of Saskatchewan Centre for Hydrology, under contract to Natural Resources Canada and Alberta Environment ...
20 / 292
Dataset 1.2
T-2021-09-29-u1iVu2kr7gxkSPOzT4tF1v1Q
Abstract
The MESH version r1589_RTE_ts450s was used. This version of MESH has a hybrid functionality which allows users to define different grid specifications for routing scheme and land surface scheme. Here, in our model, routing scheme has a cell resolution of 0.0083 degree and land surface scheme has a resolution of 0.09 degree. The model includes 13 Ground Response Unit (GRU) classes.
The Digital Elevation Models (DEM) was downloaded from USGS HydroSHEDS database with 30 arc-second resolution. Soil data was obtained from Global Soil Dataset for Earth System Models (Shangguan et al. 2014) (http://globalchange.bnu.edu.cn/research/soilw) and the landcover data was obtained from Climate Change Initiative (CCI) Land Cover 2015.
The forcing data was extracted from the Global Environmental Multiscale atmospheric model and the Canadian Precipitation Analysis (GEM-CaPA) which a high-resolution gridded database.
Purpose
The main goal of this project is to accurately estimate streamflow from creeks and tributaries to the main stem of Grand River. The estimated streamflow will be used to estimate non-point nitrogen loads to the main stem of the river and in order to improve the estimation of nitrogen loads from Grand River to Lake Erie. This project supports the Water Quality Modelling theme of the Core Modelling and Forecasting Team.
21 / 292
Dataset 1.2
T-2023-10-12-e18UpSy3kDUiFBDArnlifEQ
Abstract
Snowmelt contributions to streamflow in mid-latitude mountain basins typically dominate other runoff sources on annual and seasonal timescales. Future increases in temperature and changes in precipitation will affect both snow accumulation and seasonal runoff timing and magnitude, but the underlying and fundamental roles of mountain basin geometry and hypsometry on snowmelt sensitivity have received little attention. To investigate the role of basin geometry in snowmelt sensitivity, a linear snow accumulation model and the Cold Regions Hydrological Modeling (CRHM) platform driven are used to estimate how hypsometry affects basin-wide snow volumes and snowmelt runoff. Area-elevation distributions for fifty basins in western Canada were extracted, normalized according to their elevation statistics, and classified into three clusters that represent top-heavy, middle, and bottom-heavy basins. Prescribed changes in air temperature alter both the snow accumulation gradient and the total snow ...
DataLineage
To investigate the role of basin geometry in snowmelt sensitivity, a linear snow accumulation model and the Cold Regions Hydrological Modeling (CRHM) platform driven are used to estimate how hypsometry affects basin-wide snow volumes and snowmelt runoff. Area-elevation distributions for fifty basins in western Canada were extracted, normalized according to their elevation statistics, and classified into three clusters that represent top-heavy, middle, and bottom-heavy basins.
Snow pillow data (Government of BC - https://aqrt.nrs.gov.bc.ca/Data/)
Manual Snow Course Stations (Government of BC - http://www.env.gov.bc.ca/wsd/data_searches/snow/asws/data/allmss_archive.csv)
Climate Normals (ECCC - https://climate.weather.gc.ca/climate_normals/index_e.html)
Purpose
Supplementary Material for - https://gwfnet.net/Metadata/Index/T-2021-11-14-J1uDfya2DqkqJ1nDmnP4l6yQ
Alongside Dataset - https://gwfnet.net/MetadataEditor/Index/T-2021-06-09-21dykb21xDw0aVRAng0DFOHw
22 / 292
Dataset 1.2
T-2023-04-13-g1g3x8G5W2Gkum6XFBkHW5Ug1
Abstract
Model calibration and validation are critical in hydrological model robustness assessment. Unfortunately, the commonly-used split-sample test (SST) framework for data splitting requires modelers to make subjective decisions without clear guidelines. This large-sample SST assessment study empirically assesses how different data splitting methods influence post-validation model testing period performance, thereby identifying optimal data splitting methods under different conditions. This study investigates the performance of two lumped conceptual hydrological models calibrated and tested in 463 catchments across the United States using 50 different data splitting schemes. These schemes are established regarding the data availability, length and data recentness of the continuous calibration sub-periods (CSPs). A full-period CSP is also included in the experiment, which skips model validation. The assessment approach is novel in multiple ways including how model building decisions are fram ...
23 / 292
Dataset 1.2
T-2020-11-30-I1NSFev5tUUSEKgex5I3xmCw
Abstract
The dataset is comprised of inputs to and outputs from the Cold Regions Hydrological Model (CRHM) when it was run as a virtual model of two classes of Canadian Prairie watersheds, as defined by Wolfe et al. (2019). These classes are Pothole Till and High Elevation Grasslands. These watersheds represented typified prairie watersheds based on physiogeography and coherent response to environmental change.Model parameters were informed by the results of Wolfe et al. (2019). The .prj files necessary to run the virtual models are included in the dataset.
Climate forcing data are from the Adjusted and Homogenized Canadian Climate Dataset from a cohort of stations contained within each watershed class and cover a period from 1960-2006. There are a series of climate sensitivity scenarios that include applying a delta method to the original climate data (i.e., 1°C increments of warming, and -20%, +10%, +20% and +30% of precipitation). The .prj and .obs files for the baseline and each sensi ...
Purpose
Prairie Water is an interdisciplinary project that prioritizes research to address pressing water security challenges and knowledge gaps in order to enhance the resilience of prairie communities. The project’s objectives and research plans are informed by working with partners from governments, communities, non-profit organisations, and industry groups.
The dataset contributes to work packages 1.2, or A(i), under Phase II of Prairie Water, “analyzing future climate and land use change using Virtual Watershed modelling”. The dataset aims to assess hydrological sensitivity of Canadian Prairie catchments to climate with seven temperature scenarios and five precipitation scenarios, and contribute to our understanding of the hydrological, biogeochemical, and ecological response of prairie watersheds to climate and land management changes.
24 / 292
Dataset 1.2
T-2021-11-25-B1tYZfnY3r0y7es3nd8M7Ew
Abstract
The dataset is comprised of inputs to and outputs from the Cold Regions Hydrological Model (CRHM) when it was run as a virtual model of the High Elevation Grasslands class, as defined by Wolfe et al. (2019). These watersheds represented typified prairie watersheds based on physiogeography and coherent response to environmental change. Model parameters were informed by the results of Wolfe et al. (2019). The .prj files necessary to run the virtual models are included in the dataset. Climate forcing data are from the Adjusted and Homogenized Canadian Climate Dataset from a cohort of stations contained within each watershed class and cover a period from 1960-2006. There are a series of climate sensitivity scenarios that include applying a delta method to the original climate data (i.e., 1°C increments of warming, and -20%, +10%, +20% and +30% of precipitation). Model output includes hourly catchment outflow, rainfall, snowfall, snow sublimation and snow water equivalent for the baseline a ...
Citations
He, Z., Spence, C., Shook, K., Whitfield, C., Pomeroy, J., Wolfe, J. (2021). Virtual Watershed Model Simulations for Typified Prairie Watersheds in High Elevation Grasslands [Dataset]. Federated Research Data Repository. https://doi.org/10.20383/102.0517
Spence, C., He, Z., Shook, K. R., Mekonnen, B. A., Pomeroy, J. W., Whitfield, C. J., and Wolfe, J. D.: Assessing hydrological sensitivity of grassland basins in the Canadian Prairies to climate using a basin classification–based virtual modelling approach, Hydrol. Earth Syst. Sci. Discuss. [preprint], https://doi.org/10.5194/hess-2021-186, in review, 2021.
Purpose
Prairie Water is an interdisciplinary project that prioritizes research to address pressing water security challenges and knowledge gaps in order to enhance the resilience of prairie communities. The project’s objectives and research plans are informed by working with partners from governments, communities, non-profit organisations, and industry groups.
The dataset contributes to work packages 1.2, or A(i), under Phase II of Prairie Water, “analyzing future climate and land use change using Virtual Watershed modelling”. The dataset aims to assess hydrological sensitivity of Canadian Prairie catchments to climate with seven temperature scenarios and five precipitation scenarios, and contribute to our understanding of the hydrological, biogeochemical, and ecological response of prairie watersheds to climate and land management changes.
25 / 292
Dataset 1.2
T-2023-10-20-Q18gfjfWemkqYkkueY15KFg
Abstract
The dataset is comprised of inputs to and outputs from the Cold Regions Hydrological Model (CRHM) when it was run as a virtual model of the seven prairie basin classes, as defined by He et al. (2023). These watersheds represented typified prairie watersheds based on physiogeography and coherent response to environmental change. Model parameters were informed by the results of He et al. (2023). The .prj files necessary to run the virtual models are included in the dataset. Climate forcing data are from the Adjusted and Homogenized Canadian Climate Dataset from a cohort of stations contained within each watershed class and cover a period from 1960-2006. There are a series of climate sensitivity scenarios that include applying a delta method to the original climate data (i.e., 1°C increments of warming, and -20%, +10%, +20% and +30% of precipitation). Model output includes hourly catchment outflow, and depression water storage in the HRUs for the baseline and each scenario. There are also ...
Citations
He, Z., Shook, K., Spence, C., Pomeroy, J., Whitfield, C. (2023). Virtual Watershed Model Simulations for Typified Prairie Watersheds in Seven Basin Classes. Federated Research Data Repository. https://doi.org/10.20383/103.0815
DatasetTitle
Virtual Watershed Model Simulations for Typified Prairie Watersheds in Seven Basin Classes
26 / 292
Exemplar (Exemplifies Available Visual Elements and Their Parameters) 1.0
T-2020-05-27-l2l1PY8gyl3l2EiFPLCdaCRjjA
PetName
Winston
VeterinarianLocation
M~A~P Classification Subclassification Interest Exemplar Template LatLon , Shape zoom: 8^^begin: bbox^bigmap: no^linecolor: blue^fillcolor: white^lineopacity: 1.0^linewidth: 3^longitudes: -118.6 -121.1^latitudes: 48.6 50.6^end^^begin pinarray^bigmap: no^order: latlon^49.45384, -120.56396, "Test Location 1", www.gwfnet.net/ping^49.12422, -120.25635, "Test Location 2"^50.10649, -119.35547, "Test Location 3"^49.97949, -118.93799, "Test Location 4"^end^^pin: latlon, 49.2, -119.0, "A one-line, quick pin, Another Test Location", https://www.gwfnet.net/ping^^begin: region^bigmap: no^level: 0^linecolor: red^linewidth: 2^fillcolor: yellow^fillopacity: 0.4^order: lonlat^-120.74784, 48.65478^-120.93109, 49.10886^-121.09583, 49.39167^-120.76008, 49.90798^-120.21076, 49.85798^-119.79167, 50.11667^-119.29228, 50.54367^-119.05934, 50.19086^-118.67881, 50.08579^end
27 / 292
GWFO Facility 1.0
T-2024-02-28-X1X1pZSPX1I9ky9FW5LTWojqg
LabEquipmentTable
AAL-ML-1 Inductively coupled plasma-optical emission spectrometry (ICP-OES) (Thermo Scientific iCAP 6300) Water quality (either major cationic elements (Al, Ca, Fe, K, Mg, Mn, Na, P, S, and Si) or trace metals (As, Cr, Cu, Ni, Pb, Sr, Zn), other trace metals upon request (B, Ag, Cd, Co, Hg, Mo, Se Tl)) per sample $65 $75 $101 AAL-ML-2 Gallery™ Discrete Analyzer (Thermo Scientific) Water quality (nutrients) per sample $30 $35 $47 AAL-ML-3a Capillary Ion Chromatograph system (Dionex ICS-5000 with auto sampler) Water quality (inorganic anions (e.g., nitrate, sulfate, chloride, bromide), organic acids (e.g., acetate, butyrate, succinate)) per sample (for 7 inorganic anions only) $40 $46 $62 AAL-ML-3b " " " " per sample (for 7 inorganic ions plus organic acids) $50 $58 $78 AAL-ML-4 Total Organic C, Total N Analyzer (Shimadzu TOC-LCPH/CPN with auto injector) Water quality (organic and inorganic carbon and total nitrogen) per sample $40 $46 $62 AAL-ML-5 Gas Chromatograph (Shimadzu) G ...
Name
Aqueous Analysis Laboratory
Purpose
The AAL contains instruments to generate baseline and time-sensitive data by measuring the elemental composition and chemical speciation of aqueous solutions to support water quality research.
28 / 292
GWFO Facility 1.0
T-2023-04-25-b1Vub112YvW0e15PMNMb26u9A
DeployableSystemsTable
SWSL-DS-1 Drone: DJI M600 Pro^^Sensors:^Riegl Mini Vux-1^Sony RGB^^Sensor Description:^Lidar Mapping unit with Integrated Sony 24mp camera^^Capabilities:^Class 1 laser product capable of producing 100,000 shots per second in a 360 degree field of view. IMU data is 200 hz. Data is post processed in Applanix and Riegl softwares. Products include .las files that are elevation colored, Intensity scale or RGB colorized. ^^Wavelength:^905nm, ^380nm-740nm per day $1,000 $1,200 $1,400 SWSL-DS-2 Drone: DJI M600 Pro^^Sensors:^Corning Hyperspectral Camera^^Sensor Description:^Push-broom Line Imaging Spectrometer^^Capabilities:^Produces continuous imaging of narrow spectral bands over a spectral range^^Wavelength:^400nm-1000nm per day $800 $960 $1,120 SWSL-DS-3 Drone: DJI Mavic 2 Pro^^Sensors:^RGB camera^^Sensor Description:^Hasselblad 20mp camera^^Capabilities:^Still imagery and video files are created using the 20MP camera. Products are jpeg and MP3 files^^Wavelength:^400nm-700nm per day $200 ...
Name
GWFO Smart Water Systems Lab (SWSL)
Purpose
The SWSL facility is the base for deployable systems such as the drone mounted and terrestrial lidar, multispectral and hyperspectral, optical, thermal, and IR cameras, along with traditional survey equipment, to generate baseline and time-sensitive data on land surface processes during snow and snow-free seasons to transform the observation of Canadian waters by detecting changes in water quantity and quality at high resolutions.
Benefits of SWSL data:
• New capabilities for measuring and forecasting water quality and quantity.
• Increased ability to predict the threat of disaster from floods and droughts.
• Information for communities and industries to reduce and manage their flood risk.
• Information for farmers and ranchers to manage drought impacts on food production.
• New opportunities to develop environmental technologies in Canada.
Lab Equipment
• 3 Permanent workstations (Students, Researchers and Scientists)
• Novatel Base station (roof mounted continuous operation) (PwrPa ...
29 / 292
GWFO Facility 1.0
T-2023-06-20-F1EDVhilbEEi1aP7fSF1CuDQ
LabEquipmentTable
UTABFWU-ML-1 Culturing:^Labconco Logic Class 2 Type A2 Biosafety Cabinet Work station provides personnel, product and environmental protection from hazardous particulates such as agents that require Biosafety Level 1 or 2. per day $30 $35 $42 UTABFWU-ML-2 Culturing:^Millipore Synergy UV Water Purification System Water purification system providing ultrapure water for laboratory needs (e.g., buffers and bacterial media preparation). per day $10 $12 $14 UTABFWU-ML-3 Culturing:^Powers Scientific Light & Temperature Control Growth Chamber Temperature-controlled unit allowing the use of large-volume flasks. Ability to control light intensity and light cycles. per day $30 $35 $42 UTABFWU-ML-4 Culturing:^Thermo Revco Elite Plus -86°C Freezer Ultra-Low Freezer allowing for the safe storage and preservation of biological samples. per day $20 $23 $28 UTABFWU-ML-5 Culturing:^VWR ADV Model 5000 Shaker Shaker allowing the use of large-volume flasks. per day $5 $6 $7 UTABFWU-ML-6 Lyophilization:^Lab ...
Name
GWFO UTSC Aquatic Biogeochemistry and Food Web Unit
Purpose
The Aquatic Biogeochemistry laboratories at the Department of Physical & Environmental Sciences, University of Toronto Scarborough, contain all the modern analytical instruments required for leading-edge research to address a multitude of environmental problems related to eutrophication, contaminant fate and transport, and fisheries. Our facilities are equipped to support a wide range of analyses of the physical, chemical, and biological properties of aquatic ecosystems. We also provide state-of-the-art instrumentation to support field research related to lake hydrodynamics and ecohydrology. The facilities are located in the Environmental Science and Chemistry Building, which is certified as LEED Gold by the Canadian Green Building Council.
30 / 292
GWFO Facility 1.0
T-2023-06-20-U1lZ1dvLm502ntcm6X7rU1qg
DeployableSystemsList
Phycological Community Analysis Portable AlgaeTorch (bbe Moldaenke)per day Handheld operational unit used for the quantification of cyanobacteria and total chlorophyll. University of Toronto 1 Phycological Community Analysis Portable PhycoLabAnalyser (bbe Moldaenke) Quick, simple chlorophyll measurement with algal class differentiation. It also provides phycocyanin measurements – an indicator for cyanotoxins as well as flavours and odorous substances. University of Toronto 1 Phycological Community Analysis Portable FluoroProbe III (bbe Moldaenke) Used for creating depth profiles of different phycological divisions. Individual profiles during the measurements are taken for green algae, blue-green algae/cyanobacteria, diatoms/dinoflagellates and cryptophytes (others can be added, e.g. Planktothrix rubescens). University of Toronto 1 Phycological Community Analysis Portable PHYTO-PAM-II^(Walz) Facilitates measurements of mixed algae populations for composition analysis and differences in ...
DeployableSystemsTable
UTHAAL-DS-1 Phycological Community Analysis:^AlgaeTorch (bbe Moldaenke) Portable^Description:^Handheld operational unit used for the quantification of cyanobacteria and total chlorophyll. per day $200 $230 $280 UTHAAL-DS-2 "" per week $1,000 $1,150 $1,400 UTHAAL-DS-3 Phycological Community Analysis:^PhycoLabAnalyser (bbe Moldaenke) Portable^Description:^Quick, simple chlorophyll measurement with algal class differentiation. It also provides phycocyanin measurements – an indicator for cyanotoxins as well as flavours and odorous substances. per day $300 $345 $420 UTHAAL-DS-4 "" per week $1,800 $2,070 $2,520 UTHAAL-DS-5 Phycological Community Analysis:^FluoroProbe III (bbe Moldaenke) Portable^Description:^Used for creating depth profiles of different phycological divisions. Individual profiles during the measurements are taken for green algae, blue-green algae/cyanobacteria, diatoms/dinoflagellates and cryptophytes (others can be added, e.g. Planktothrix rubescens). per day $300 $345 ...
LabEquipmentTable
UTHAAL-ML-1 Flow Cytometry:^CytoFLEX Flow Cytometer (Beckman Coulter) Cell analysis system used for the qualitative and quantitative measurement of biological and physical properties of cells and other particles. Application flexibility, including an optional 96-well Plate Loader, 13 bandpass filters, and two lasers (Blue and Red). per hour $100 $115 $140 UTHAAL-ML-2 Flow Cytometry:^PhytoCyt flow cytometer (Turner Designs) Portable Cell analysis system used for many applications (e.g., cell counting, viability assays, physiological characterization, etc.). The optical filters and lasers have been optimized to detect the endogenous fluorophores common to phytoplankton, including phycoerythrin, chlorophyll and phycocyanins. One of the detectors has been optimized for green fluorescence detection, which allows labelling with exogenous reagents. per day $200 $230 $280 UTHAAL-ML-3 "" "" per week $1,200 $1,380 $1,680 UTHAAL-ML-4 Microscopy:^IX73 Inverted LED Fluorescence Microscope (Olympus) ...
Name
GWFO UTSC Harmful Algae Analytical Unit
Purpose
The UTSC Harmful Algae Analytical Unit generates baseline and time-sensitive data to understand the drivers influencing phytoplankton dynamics (community composition, ecology, and physiology), with an emphasis on examining harmful algal blooms. In addition, it provides open-access data obtained from a combination of field and laboratory-based techniques to investigate aquatic microbial communities and contains modern analytical equipment for algal culturing, algal class analyses (e.g., PhycoLabAnalyser, fluoroprobe and PHYTO-PAM), phytoplankton identification and enumeration (e.g., high-resolution microscopy, FlowCam), and toxin analyses.
31 / 292
GWFO Facility 1.0
T-2024-02-28-B1PYJSWaM7EKoMWQSNbYpfw
LaboratoryNotes
<sup>A</sup> Ten sample minimum.
<sup>B</sup> Samples must be freeze-dried and homogenized.
<sup>C</sup> For samples submitted ‘ready-to-analyze’, please contact us for advice regarding sample preparation and submission.
<sup>D</sup> Please specify target analytes.
<sup>E</sup> For add-on with other analytes only.
<sup>F</sup> For samples submitted ‘ready-to-analyze’ (i.e., pre-weighed in tin capsules)
<sup>G</sup> A $5 discount will apply to samples received ‘ready-to-analyze’
<sup>H</sup> Per class of co-extractable routine analytes (please see: https://www.trentu.ca/wqc/facilities-services/services)
<sup>I</sup> Solid samples include biota, sediments, soils, etc.
All prices are subject to change
Services subject to availability.
Name
Water Quality Centre
Purpose
The Trent Water Quality Centre (WQC) is the most comprehensive mass spectrometry
facility in Canada that generates baseline and time-sensitive data via measuring isotopes
and trace amounts of organic and inorganic contaminants in biological material (food
products, plants, invertebrates, bird eggs and feathers, fur), sediments, soils, fly ash,
municipal wastewaters, industrial by-products, process waters and other environmental
compartments.
Our analyses to generate data include:
• stable isotopes (eg. δ<sup>13</sup>C, δ<sup>15</sup>N, δ<sup>18</sup>O, deuterium, Mg, Fe, Zn, Hg, U) and radiogenic
(eg. Sr, Pb, Nd) isotope ratios
• single particle analysis
• emerging contaminants (eg. pharmaceuticals, personal care products)
• volatile fatty acids (VFAs)
• total Hg (no sample preparation required for solids)
• transition metal scans
• determination of low concentrations (ppt or ppq) of most metals
• P, S, Ca, Mg, Na, K analyses
32 / 292
Project 1.2
T-2024-07-30-T1rEUJ3sMWUiFcewHmHVAfg
Description
The Bridge to Land Water Sky is Canada's only Indigenous-led Living Lab, inspiring a more resilient agriculture industry and the next wave of farmers. As the only Indigenous-led Living Lab in Canada, the Bridge to Land Water Sky will focus on identifying barriers Indigenous people face when entering the Agricultural Industry and will celebrate Indigenous knowledge as a key factor in building a more innovative and climate-resilient agricultural industry with global impacts.
Goals:
1. Improve land management strategies for the mitigation of greenhouse gas emissions and improve carbon sequestration. We will test beneficial practices for revitalization and improvement of our land and soils.
2. Increase food security and sovereignty in Indigenous and non-Indigenous communities to benefit local food production and medicinal and traditional plants for Indigenous communities.
3. Protect biodiversity and water to support healthy ecosystems, people, and environmental co-benefits, including ...
33 / 292
Project 1.2
T-2021-03-16-t1FePIyN2akSSzuY3rRbESA
Description
Special Issue of Hydrology and Earth System Sciences (HESS)
Understanding and predicting Earth system and hydrological change in cold regions
(edited by S. Carey, C. DeBeer, J. Hanesiak, Y. Li, J. Pomeroy, B. Schaefli, M. Weiler, and H. Wheater):
https://hess.copernicus.org/articles/special_issue919.html
Short description: CCRN observes, diagnoses, and predicts environmental change in the Saskatchewan and Mackenzie River Basins.
To integrate existing and new sources of data with improved predictive and observational tools to understand, diagnose and predict interactions amongst the cryospheric, ecological, hydrological, and climatic components of the changing Earth system at multiple scales, with a geographic focus on Western Canada’s rapidly changing cold interior.
The cold interior of Western Canada east of the Continental Divide has one of the world's most extreme and variable climates and is experiencing rapid environmental change. In a region which includes a multiplicity o ...
34 / 292
Project 1.2
T-2021-02-18-D1TV3STW3ikGEHlUSYOaOlg
Description
Core Modelling and Forecasting is a GWF core team which performs world-class, leading-edge water science for cold regions to address the needs of the Canadian economy in adapting to change and managing risks associated with the uncertain water futures and extreme events brought about by climate change. Its research is delivered under eight themes:
1. Spatial Meteorological Forcing Data (https://gwf.usask.ca/core-modelling/research-themes/spatial-meteorological-forcing-data.php);
2. Geospatial Intelligence (https://gwf.usask.ca/core-modelling/research-themes/geospatial-intelligence.php);
3. Current Generation Hydrological Modelling (https://gwf.usask.ca/core-modelling/research-themes/current-generation-modelling.php);
4. Next Generation Hydrological Modelling (https://gwf.usask.ca/core-modelling/research-themes/next-generation-hydrological-modelling.php);
5. Water Resources Management (https://gwf.usask.ca/core-modelling/research-themes/water-resources-management.php);
6. Water Quality ...
35 / 292
Publication 1.0
T-2024-01-29-u1SblVVCIZEqZPIsyYJXzLw
Abstract
Since the report of the RNA aptamer for theophylline, theophylline has become a key molecule in chemical biology for designing RNA switches and riboswitches. In addition, theophylline is an important drug for treating airway diseases including asthma. The classic RNA aptamer with excellent selectivity for theophylline has been used to design biosensors, although DNA aptamers are more desirable for stability and cost considerations. In this work, we selected DNA aptamers for theophylline, and all the top sequences shared the same binding motifs. Binding was confirmed using isothermal titration calorimetry and a nuclease digestion assay, showing a dissociation constant (Kd) around 0.5 μM theophylline. The Theo2201 aptamer can be truncated down to 23-mer while still has a Kd of 9.8 μM. The selectivity for theophylline over caffeine is around 250,000-fold based on a strand-displacement assay, which was more than 20-fold higher compared to the classic RNA aptamer. For other tested analogs, ...
Authorship
Huang, P.-J. J., Liu, J.
Citation
Huang, P.-J. J., Liu, J. (2022). A DNA Aptamer for Theophylline with Ultrahigh Selectivity Reminiscent of the Classic RNA Aptamer. ACS Chemical Biology 2022, 17, 2121-2129. https://doi.org/10.1021/acschembio.2c00179
Project
GWF-WSPT: Winter Soil Processes in Transition|GWF-SSSWQM: Sensors and Sensing Systems for Water Quality Monitoring|
PublicationType
Journal Article
Title
A DNA Aptamer for Theophylline with Ultrahigh Selectivity Reminiscent of the Classic RNA Aptamer
Year
2022
36 / 292
Publication 1.0
T-2023-01-19-P11pi9rKOSkq2VP1VRu3kUrw
Authorship
Crasto, N., Hopkinson, C., Forbes, D. L., Lesack, L., Marsh, P., Spooner, I., & van der Sanden, J. J.
Citation
Crasto, N., Hopkinson, C., Forbes, D. L., Lesack, L., Marsh, P., Spooner, I., & van der Sanden, J. J. (2015). A LiDAR-based decision-tree classification of open water surfaces in an Arctic delta. Remote Sensing of Environment, 164, 90-102. https://doi.org/10.1016/j.rse.2015.04.011
PublicationType
Journal Article
Title
A LiDAR-based decision-tree classification of open water surfaces in an Arctic delta
Year
2015
37 / 292
Publication 1.0
T-2024-12-19-B1i87xzJ7QkKpllAeNlWs9A
Abstract
Seasonal temperature trend and ice phenology in Great Slave lake (GSL), are strongly influenced by warmer inflow from Slave river. The Slave river flows to GSL through Slave river delta (SRD), bringing a rise in temperature that triggers the ice break-up process of the lake. Slave river discharge is subject to multiple stressors including climate warming and upstream water activities, which in turn, directly affects the GSL break-up process. Consequently, monitoring the break-up process at SRD, where the river connects to the lake, serves as an indicator to better understand the cascading effects on GSL ice break-up. This research aims to develop random forest (RF) models to monitor the SRD ice break-up processes, using a combination of satellite images with optical sensors at high spatial resolution, including Landsat-5, Landsat-8, Sentinel-2a, and Sentinel-2b. The RF models were trained using manually selected training pixels to classify ice, open water, and cloud within the SRD. The ...
Authorship
Moalemi, Ida
Citation
Moalemi, Ida (2023) A Machine Learning Approach to Classify Open Water and Ice Cover on Slave River Delta, Scholars Commons Laurier - Theses and Dissertations, https://scholars.wlu.ca/etd/2598
PublicationType
Thesis
Title
A Machine Learning Approach to Classify Open Water and Ice Cover on Slave River Delta
Year
2023
38 / 292
Publication 1.0
T-2022-12-03-l15MwDkRdOUeBWySzzrJFoQ
Abstract
Evolutionary coupling is a well investigated phenomenon in software maintenance research and practice. Association rules and two related measures, support and confidence, have been used to identify evolutionary coupling among program entities. However, these measures only emphasize the co-change (i.e., changing together) frequency of entities and cannot determine whether the entities co-evolved by experiencing related changes. Consequently, the approach reports false positives and fails to detect evolutionary coupling among infrequently co-changed entities. We propose a new measure, identifier correspondence (id-correspondence), that quantifies the extent to which changes that occurred to the co-changed entities are related based on identifier similarity. Identifiers are the names given to different program entities such as variables, methods, classes, packages, interfaces, structures, unions etc. We use Dice-Sørensen co-efficient for measuring lexical similarity between the identifier ...
Authorship
Mondal M, Roy B, Roy CK, and Schneider KA, ID-correspondence
Citation
Mondal M, Roy B, Roy CK, and Schneider KA, ID-correspondence: A Measure for Detecting Evolutionary Coupling, Empirical Software Engineering 26, 5 (2021), https://link.springer.com/article/10.1007/s10664-020-09921-9.
Project
GWF-CS: Computer Science|
PublicationType
Journal Article
Year
2021
39 / 292
Publication 1.0
T-2022-12-05-i11kdZi2k99UWBCQXkevZIfw
Abstract
A devastating, flood-producing rainstorm occurred over southern Alberta, Canada, from 19 to 22 June 2013. The long-lived, heavy rainfall event was a result of complex interplays between topographic, synoptic, and convective processes that rendered an accurate simulation of this event a challenging task. In this study, the Weather Research and Forecasting (WRF) Model was used to simulate this event and was validated against several observation datasets. Both the timing and location of the model precipitation agree closely with the observations, indicating that the WRF Model is capable of reproducing this type of severe event. Sensitivity tests with different microphysics schemes were conducted and evaluated using equitable threat and bias frequency scores. The WRF double-moment 6-class microphysics scheme (WDM6) generally performed better when compared with other schemes. The application of a conventional convective/stratiform separation algorithm shows that convective activity was domi ...
Authorship
Li, Y., Szeto, K., Stewart, R. E., Thériault, J. M., Chen, L., Kochtubajda, B., Liu, A., Boodoo, S., Goodson, R., Mooney, C. & Kurkute, S.
Citation
Li, Y., Szeto, K., Stewart, R. E., Thériault, J. M., Chen, L., Kochtubajda, B., Liu, A., Boodoo, S., Goodson, R., Mooney, C. & Kurkute, S. (2017). A Numerical Study of the June 2013 Flood-Producing Extreme Rainstorm over Southern Alberta. Journal of Hydrometeorology, 18(8), 2057-2078. https://doi.org/10.1175/JHM-D-15-0176.1
PublicationType
Journal Article
Year
2017
40 / 292
Publication 1.0
T-2023-01-04-w1ogIhvCgskWw2yVMcG7w1w3kg
Authorship
Obadia, M., DeVries, B., Park, G., Merchant, M. A., and Berg, A. A.
Citation
Obadia, M., DeVries, B., Park, G., Merchant, M. A., and Berg, A. A.: A Spatiotemporal Surface Water Classification in the Mackenzie Delta and Tuktoyaktuk Peninsula, American Geophysical Union Meeting, Virtual, 2021
Project
GWF-NWF: Northern Water Futures|
PublicationType
Conference Presentation
Title
A Spatiotemporal Surface Water Classification in the Mackenzie Delta and Tuktoyaktuk Peninsula
Year
2021
41 / 292
Publication 1.0
T-2025-10-21-T1jswT1Oyq3UuLmVjP7ewKWw
Abstract
Urbanization significantly alters natural hydrological processes, leading to increased flood risks in urban areas. The potential damages caused by flooding in urban areas are widely recognized, making it crucial for urban residents to be well-informed about flood risks to mitigate potential losses. Flood maps serve as essential tools in this regard, providing valuable information that aids in effective planning, risk assessment, and decision-making. Despite floods being the most common natural disasters in Canada, many Canadians still lack access to high-quality, up-to-date flood maps. The occurrence of recent major flood events across the country has sparked renewed interest among government officials and stakeholders in launching new flood mapping initiatives. These projects are critical for enhancing flood risk management across communities.
Traditional flood hazard mapping methods, based on deterministic approaches, often fail to account for the complexities and uncertainties inher ...
Authorship
Abedin, S. J. H.
Project
GWF-LSNPM: Linking Stream Network Process Models to Robust Data Management Systems (for the Purpose of Land-Use Decision Support)|
PublicationType
Thesis
Year
2024
42 / 292
Publication 1.0
T-2024-07-18-E1sA4lNv2zE1upwvoQaOE1E2QA
Abstract
Climate change is rapidly altering composition, structure, and functioning of the boreal biome, across North America often broadly categorized into ecoregions. The resulting complex changes in different ecoregions present a challenge for efforts to accurately simulate carbon dioxide (CO2) and energy exchanges between boreal forests and the atmosphere with terrestrial ecosystem models (TEMs). Eddy covariance measurements provide valuable information for evaluating the performance of TEMs and guiding their development. Here, we compiled a boreal forest model benchmarking dataset for North America by harmonizing eddy covariance and supporting measurements from eight black spruce (Picea mariana)-dominated, mature forest stands. The eight forest stands, located in six boreal ecoregions of North America, differ in stand characteristics, disturbance history, climate, permafrost conditions and soil properties. By compiling various data streams, the benchmarking dataset comprises data to parame ...
Authorship
Qu, Bo, Roy, Alexandre, Melton, Joe R., Black, T.Andrew, Amiro, Brian, Euskirchen, Eugénie S., Ueyama, Masahito, Kobayashi, Hideki, Schulze, Christopher, Gosselin, Gabriel Hould, Cannon, Alex J., Detto, Matteo, Sonnentag, Oliver
Citation
Qu, Bo, Roy, Alexandre, Melton, Joe R., Black, T.Andrew, Amiro, Brian, Euskirchen, Eugénie S., Ueyama, Masahito, Kobayashi, Hideki, Schulze, Christopher, Gosselin, Gabriel Hould, Cannon, Alex J., Detto, Matteo, Sonnentag, Oliver (2023) A boreal forest model benchmarking dataset for North America: a case study with the Canadian Land Surface Scheme Including Biogeochemical Cycles (CLASSIC). Environ. Res. Lett. 18 085002. https://doi.org/10.1088/1748-9326/ace376
Project
GWF-NWF: Northern Water Futures|
PublicationType
Journal Article
Title
A boreal forest model benchmarking dataset for North America: a case study with the Canadian Land Surface Scheme Including Biogeochemical Cycles (CLASSIC)
Year
2023
43 / 292
Publication 1.0
T-2022-12-03-u1au1Pbk0010iu246m6BZok9Q
Abstract
The freeze-thaw cycle associated with climatic seasonality is a common phenomenon in cold regions affecting a wide range of subsurface processes. Due to the complex and highly nonlinear nature of the associated hydrologic processes, transient freeze-thaw dynamics are conventionally quantified in a numerical way. Here we present a hybrid analytical-numerical scheme for solving one-dimensional soil (or porous media) temperature profiles when the soil profile is subjected to unidirectional freezing (or thawing) conditions. This scheme divides the partially-frozen soil into multi-layers, each with constant thermal parameters and fixed-temperature boundaries. Temperature profiles within each layer were obtained by solving multiple moving-boundary problems. The proposed hybrid analytical-numerical scheme was tested into a freezing test of silty clay in a permafrost region on the Qinghai-Tibetan Plateau, and its solution was in good agreement with the finite element numerical solution. Result ...
Authorship
Huang, X., Rudolph, D. L., and Glass, B.
Citation
Huang, X., Rudolph, D. L., and Glass, B.: A coupled thermal-hydraulic-mechanical approach to modelling roadbed frost loading on water mains, Water Resources Research, 58, e2021WR030933, https://doi.org/10.1029/2021WR030933, 2022
Project
GWF-NWF: Northern Water Futures|
PublicationType
Journal Article
Year
2022
44 / 292
Publication 1.0
T-2024-10-30-R16zJgSFmAkuR1I86TSQDTLQ
Abstract
Land surface models (LSMs) are used to simulate water and energy fluxes between the land surface and atmosphere. These simulations are useful for water resources management, drought and flood prediction, and numerical climate/weather prediction. However, the usefulness of LSMs are dependent by their ability to reproduce states and fluxes realistically. Accurate measurements of water storage are useful to calibrate and validate LSMs outputs. Geological Weighing Lysimeters (GWLs) are instruments that can provide field-scale estimates of integrated total water storage within a soil profile. We use field estimates of total water storage and subsurface storage to critically evaluate two different land surface models: the Modélisation Environnementale communautaire - Surface Hydrology (MESH) which uses the Canadian Land Surface Scheme (CLASS), and the Structure for Unifying Multiple Modeling Alternatives: (SUMMA). These models have differences in how the processes and properties of the land ...
Authorship
Braaten Morgan, Ireson Andrew, Clark Martyn
Citation
Braaten Morgan, Ireson Andrew, Clark Martyn (2024) A critical assessment of Geological Weighing Lysimeters: Part 2 - modelling field scale soil moisture storage and hydrological fluxes, Authorea, Submitted to Hydrological Processes
Project
GWF-HPFS: Hydrological Processes in Frozen Soils|
PublicationType
Journal Article
Year
2024
45 / 292
Publication 1.0
T-2023-01-19-i1xGaQoqYwE6TxWlLHhox6A
Authorship
Chasmer, L., Hopkinson, C., Veness, T., Quinton, W., & Baltzer, J.
Citation
Chasmer, L., Hopkinson, C., Veness, T., Quinton, W., & Baltzer, J. (2014). A decision-tree classification for low-lying complex land cover types within the zone of discontinuous permafrost. Remote Sensing of Environment, 143, 73-84. https://doi.org/10.1016/j.rse.2013.12.016
PublicationType
Journal Article
Title
A decision-tree classification for low-lying complex land cover types within the zone of discontinuous permafrost
Year
2014
46 / 292
Publication 1.0
T-2022-12-03-q1V4vhesCv0q1bZXezO3wdq2w
Abstract
The freeze-thaw cycle associated with climatic seasonality is a common phenomenon in cold regions affecting a wide range of subsurface processes. Due to the complex and highly nonlinear nature of the associated hydrologic processes, transient freeze-thaw dynamics are conventionally quantified in a numerical way. Here we present a hybrid analytical-numerical scheme for solving one-dimensional soil (or porous media) temperature profiles when the soil profile is subjected to unidirectional freezing (or thawing) conditions. This scheme divides the partially-frozen soil into multi-layers, each with constant thermal parameters and fixed-temperature boundaries. Temperature profiles within each layer were obtained by solving multiple moving-boundary problems. The proposed hybrid analytical-numerical scheme was tested into a freezing test of silty clay in a permafrost region on the Qinghai-Tibetan Plateau, and its solution was in good agreement with the finite element numerical solution. Result ...
Authorship
Huang, X. and Rudolph, D.L.
Citation
Huang, X. and Rudolph, D.L., 2022. A hybrid analytical-numerical technique for solving soil temperature during the freezing process, Advances in Water Resources, https://doi.org/10.1016/j.advwatres.2022.104163.
Project
GWF-TSTSW: Transformative Sensor Technologies and Smart Watersheds|
PublicationType
Journal Article
Year
2022
47 / 292
Publication 1.0
T-2021-11-14-b1BgQgAS3GEWl2oYjlkCU5g
Abstract
A code clone is a pair of code fragments, within or between software systems that are similar. Since code clones often negatively impact the maintainability of a software system, several code clone detection techniques and tools have been proposed and studied over the last decade. However, the clone detection tools are not always perfect and their clone detection reports often contain a number of false positives or irrelevant clones from specific project management or user perspective. To detect all possible similar source code patterns in general, the clone detection tools work on the syntax level while lacking user-specific preferences. This often means the clones must be manually inspected before analysis in order to remove those false positives from consideration. This manual clone validation effort is very time-consuming and often error-prone, in particular for large-scale clone detection. In this paper, we propose a machine learning approach for automating the validation process. ...
Authorship
Mostaeen, G., Roy, B., Roy, C. K., Schneider, K., & Svajlenko, J.
Citation
Mostaeen, G., Roy, B., Roy, C. K., Schneider, K., & Svajlenko, J. (2020). A machine learning based framework for code clone validation. Journal of Systems and Software, 169, 110686. https://doi.org/10.1016/j.jss.2020.110686.
Project
GWF-CS: Computer Science|
PublicationType
Journal Article
Year
2020
48 / 292
Publication 1.0
T-2022-12-03-I1maNG3fKI2kiuGaaoT4GZSw
Abstract
Study region
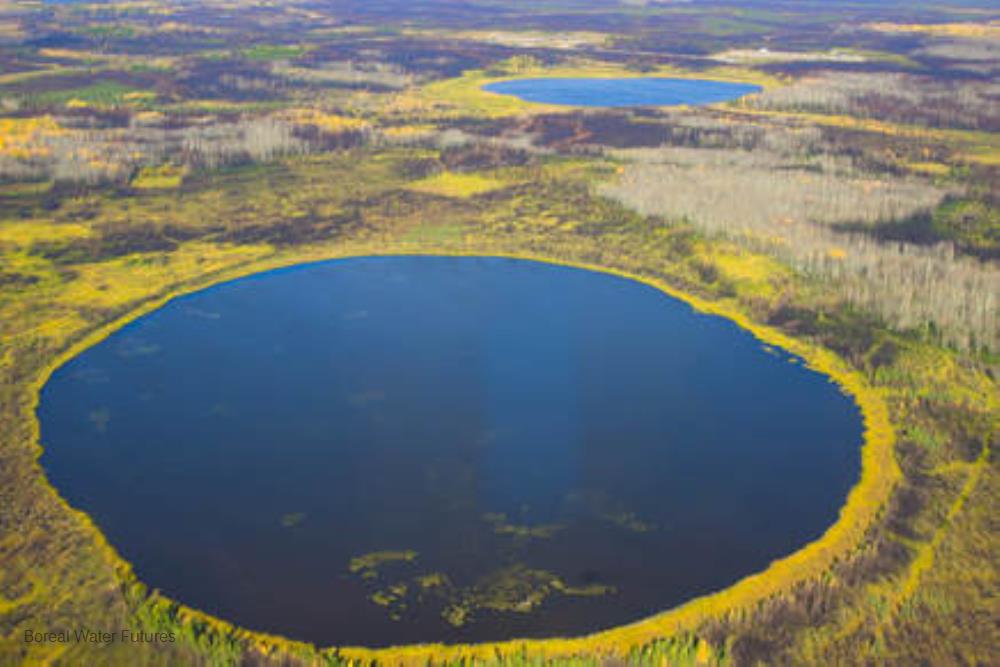
The Peace-Athabasca Delta, a Ramsar Wetland of International Importance in northeastern Alberta, is protected within Wood Buffalo National Park and contributes to its UNESCO World Heritage status yet is threatened by climate change and upstream energy projects.
Study focus
Recent drawdown of the delta’s abundant shallow lakes and rivers has deteriorated vital habitat for wildlife and impaired navigation routes. Here, we report continuous measurements at ~50 lakes during open-water seasons of 2018 and 2019 to improve understanding of hydrological processes causing lake-level variation.
New hydrological insights for the region
Analyses reveal four patterns of lake-level variation attributable to influential hydrological processes, which provide the basis for a new lake classification scheme: 1) ‘Drawdown’ (≥15 cm decline) by evaporation and/or outflow after ice-jam floods, 2) ‘Stable’ lake levels (<15 cm change) sustained by rainfall, 3) ‘Gradual Rise’ by inundation from t ...
Authorship
Neary, L. K., Remmer, C. R., Krist, J., Wolfe, B. B., and Hall, R. I.
Citation
Neary, L. K., Remmer, C. R., Krist, J., Wolfe, B. B., and Hall, R. I.: A new lake classification scheme for the Peace-Athabasca Delta (Canada) characterizes hydrological processes that cause lake-level variation, Journal of Hydrology: Regional Studies (Special Issue: Water and Environmental Management in Oil Sands Regions), 38, 100948. https://doi.org/10.1016/j.ejrh.2021.100948, 2021
Project
GWF-NWF: Northern Water Futures|
PublicationType
Journal Article
Title
A new lake classification scheme for the Peace-Athabasca Delta (Canada) characterizes hydrological processes that cause lake-level variation
Year
2021
49 / 292
Publication 1.0
T-2021-11-12-r1XgmsZc7jEar3aV64y9YoLQ
Abstract
This paper presents a novel data fusion technique for improving the snow cover monitoring for a mesoscale Alpine region, in particular in those areas where two information sources disagree. The presented methodological innovation consists in the integration of remote-sensing data products and the numerical simulation results by means of a machine learning classifier (support vector machine), capable to extract information from their quality measures. This differs from the existing approaches where remote sensing is only used for model tuning or data assimilation. The technique has been tested to generate a time series of about 1300 snow maps for the period between October 2012 and July 2016. The results show an average agreement between the fused product and the reference ground data of 96%, compared to 90% of the moderate-resolution imaging spectroradiometer (MODIS) data product and 92% of the numerical model simulation. Moreover, one of the most important results is observed from the ...
Authorship
De Gregorio, L., Callegari, M., Marin, C., Zebisch, M., Bruzzone, L., Demir, B., Strasser, U., Marke, T., Günther, D., Nadalet, R. and Notarnicola, C.
Citation
De Gregorio, L., Callegari, M., Marin, C., Zebisch, M., Bruzzone, L., Demir, B., Strasser, U., Marke, T., Günther, D., Nadalet, R. and Notarnicola, C. (2019): A novel data fusion technique for snow cover retrieval, Journal of Selected Topics in Applied Earth Observations and Remote Sensing JSTARS, Vol. 12, No. 8, https://doi.org/10.1109/JSTARS.2019.2920676.
Project
INARCH1: International Network of Alpine Research Catchment Hydrology (Phase 1)|
PublicationType
Journal Article
Year
2019
50 / 292
Publication 1.0
T-2024-10-30-R1R13ls13x6Eqn2Xs7t0de5A
Abstract
Mountain water resources are of particular importance for downstream populations but are threatened by decreasing water storage in snowpack and glaciers. Groundwater contribution to mountain streamflow, once assumed to be relatively small, is now understood to represent an important water source to streams. This review presents an overview of research on groundwater in high mountain environments (As classified by Meybeck et al. (2001) as very high, high, and mid-altitude mountains). Coarse geomorphic units, like talus, alluvium, and moraines, are important stores and conduits for high mountain groundwater. Bedrock aquifers contribute to catchment streamflow through shallow, weathered bedrock but also to higher order streams and central valley aquifers through deep fracture flow and mountain-block recharge. Tracer and water balance studies have shown that groundwater contributes substantially to streamflow in many high mountain catchments, particularly during low-flow periods. The perce ...
Authorship
Somers LD, McKenzie JM.
Citation
Somers LD, McKenzie JM. (2020) A review of groundwater in high mountain environments., WIREs Water. 2020; 7:e1475
PublicationType
Journal Article
Year
2020
51 / 292
Publication 1.0
T-2023-04-05-91HkNa2UGBESJdVfsYLt1wQ
Abstract
Wastewater surveillance (WWS) is useful to better understand the spreading of coronavirus disease 2019 (COVID-19) in communities, which can help design and implement suitable mitigation measures. The main objective of this study was to develop the Wastewater Viral Load Risk Index (WWVLRI) for three Saskatchewan cities to offer a simple metric to interpret WWS. The index was developed by considering relationships between reproduction number, clinical data, daily per capita concentrations of virus particles in wastewater, and weekly viral load change rate. Trends of daily per capita concentrations of SARS-CoV-2 in wastewater for Saskatoon, Prince Albert, and North Battleford were similar during the pandemic, suggesting that per capita viral load can be useful to quantitatively compare wastewater signals among cities and develop an effective and comprehensible WWVLRI. The effective reproduction number (Rt) and the daily per capita efficiency adjusted viral load thresholds of 85 × 106 and ...
Authorship
Asadi Mohsen, Oloye Femi F., Xie Yuwei, Cantin Jenna, Challis Jonathan K., McPhedran Kerry N.,Yusuf Warsame , Champredon David, Xia Pu, De Lange Chantel,El-Baroudy Seba , Servos Mark R., Jones Paul D., Giesy John P., Brinkmann Markus
Citation
Asadi Mohsen, Oloye Femi F., Xie Yuwei, Cantin Jenna, Challis Jonathan K., McPhedran Kerry N.,Yusuf Warsame , Champredon David, Xia Pu, De Lange Chantel,El-Baroudy Seba , Servos Mark R., Jones Paul D., Giesy John P., Brinkmann Markus (2023). A wastewater-based risk index for SARS-CoV-2 infections among three cities on the Canadian Prairie. Science of The Total Environment, Volume 876, 2023, 162800 https://doi.org/10.1016/j.scitotenv.2023.162800
Project
GWF-NGS: Next Generation Solutions for Healthy Water Resources|GWF-TSTSW: Transformative Sensor Technologies and Smart Watersheds|
PublicationType
Journal Article
Year
2023
52 / 292
Publication 1.0
T-2022-12-05-H10UkIg45XkunvoASXyo4kw
Abstract
Classification and clustering approaches provide a means to group watersheds according to similar attributes, functions, or behaviours, and can aid in managing natural resources. Although they are widely used, approaches based on hydrological response parameters restrict analyses to regions where well-developed hydrological records exist, and overlook factors contributing to other management concerns, including biogeochemistry and ecology. In the Canadian Prairie, hydrometric gauging is sparse and often seasonal. Moreover, large areas are endorheic and the landscape is highly modified by human activity, complicating classification based solely on hydrological parameters. We compiled climate, geological, topographical, and land-cover data from the Prairie and conducted a classification of watersheds using a hierarchical clustering of principal components. Seven classes were identified based on the clustering of watersheds, including those distinguishing southern Manitoba, the pothole re ...
Authorship
Wolfe, J. D., Shook, K. R., Spence, C., & Whitfield, C. J.
Citation
Wolfe, J. D., Shook, K. R., Spence, C., & Whitfield, C. J. (2019). A watershed classification approach that looks beyond hydrology: application to a semi-arid, agricultural region in Canada. Hydrology & Earth System Sciences, 23(9), 3945-3967. https://doi.org/10.5194/hess-23-3945-2019.
PublicationType
Journal Article
Summary
Watershed classification can identify regions expected to respond similarly to disturbance. Methods should extend beyond hydrology to include other environmental questions, such as ecology and water quality. We developed a classification for the Canadian Prairie and identified seven classes defined by watershed characteristics, including elevation, climate, wetland density, and surficial geology. Results provide a basis for evaluating watershed response to land management and climate condition.
Title
A watershed classification approach that looks beyond hydrology: application to a semi-arid, agricultural region in Canada
Year
2019
53 / 292
Publication 1.0
T-2023-01-04-e1JBr20xJrUCpkU1JOW47Qg
Authorship
Elshamy, M., Abdelhamed, M., Razavi, S., Pietroniro, A., Pomeroy, J., Wheater, H. (May
Citation
Elshamy, M., Abdelhamed, M., Razavi, S., Pietroniro, A., Pomeroy, J., Wheater, H. (May 2021) Advances in Permafrost Modelling: Enhancing MESH/CLASS to represent Permafrost Dynamics. Global Water Futures (GWF) 2021 Fourth Annual Open Science Meeting, virtual event, May 17, 2021 to May 19, 2021
Project
GWF-IMPC: Integrated Modelling Program for Canada|GWF-CORE: Core Modelling and Forecasting|GWF-MWF: Mountain Water Futures|
PublicationType
Conference Presentation
Title
Advances in Permafrost Modelling: Enhancing MESH/CLASS to represent Permafrost Dynamics
Year
2021
54 / 292
Publication 1.0
T-2025-09-11-C13NH0cE13Uu0wHC2sivT6Vw
Abstract
Agriculture is a cornerstone of global food production, accounting for a substantial portion of water withdrawals worldwide. As the world’s population grows, so does the demand for water in agriculture, leading to alterations in regional water–energy balances. We present an approach to identify the influence of agriculture on the water–energy balance using empirical data. We explore the departure from the Budyko curve for catchments with agricultural expansion and their associations with changes in the water–energy balance using a causal discovery algorithm. Analyzing data from 1,342 catchments across three Köppen-Geiger climate classes—temperate, snowy, and others—from 1980 to 2014, we show that temperate and snowy catchments, which account for over 90% of stations, exhibit distinct patterns. Cropland percentage (CL%) emerges as the dominant factor, explaining 47 and 37% of the variance in deviations from the Budyko curve in temperate and snowy catchments, respectively. In temperate c ...
Authorship
Zaerpour M., Hatami S., Ballarin A. S., Papalexiou S. M., Pietroniro A., Nazemi A.
Citation
Zaerpour M., Hatami S., Ballarin A. S., Papalexiou S. M., Pietroniro A., Nazemi A. (2025) Agriculture’s impact on water–energy balance varies across climates, Proceedings of the National Academy of Sciences, Vol 122, Iss 12, https://doi.org/10.1073/pnas.2410521122
PublicationType
Journal Article
Year
2025
55 / 292
Publication 1.0
T-2024-12-19-K1jVJRVj0K1kC6r9zk4M3sK2Q
Abstract
Alpine regions receive large volumes of precipitation and are important to local and regional water balances, particularly during baseflow periods of winter cold and summer drought when the larger basin area is frozen and/or water limited. Alpine headwaters in western Canada are expected to warm and receive more precipitation during the coming decades, with implications for groundwater recharge and streamflow generation within these systems and the regional river networks to which they contribute. Throughout the North, thawing peat plateaus and other ice-rich permafrost features are resulting in an increased extent of thermokarst and wetland land cover. This transition places infrastructure and water resources at risk as the structural integrity and reliable flow paths previously maintained by the frozen soils become compromised. Alpine systems are particularly susceptible to hydrological change due to the amplification of climate warming with both latitude and elevation. The inherent ...
Authorship
Kershaw, G.
Citation
Kershaw, Geoffrey (2022) Alpine shrub tundra water storage and runoff dynamics in the Mackenzie mountains, Sahtú Territory, NT, Scholars Commons Laurier - Theses and Dissertations, https://scholars.wlu.ca/etd/2449
PublicationType
Thesis
Year
2022
56 / 292
Publication 1.0
T-2024-12-19-J1U3sTFIQTkyaJ2E9bFt0Npw
Abstract
Object-oriented programming has had a significant impact on software development because it provides programmers with a clear structure of a large system. It encapsulates data and operations into objects, groups objects into classes and dynamically binds operations to program code. With the emergence of multi-core processors, application developers have to explore concurrent programming to take full advantage of multi-core technology. However, when it comes to concurrent programming, object-oriented programming remains elusive as a useful programming tool. Most object-oriented programming languages do have some extensions for concurrency, but concurrency is implemented independently of objects: for example, concurrency in Java is managed separately with the Thread object. We employ a programming model called Lime that combines action systems tightly with object-oriented programming and implements concurrency by extending classes with actions and guarded methods. This provides programme ...
Authorship
Yao, Shucai
Citation
Yao, Shucai (2020) An Efficient Implementation of Guard-Based Synchronization for an Object-Oriented Programming Language, MacSphere Open Access Dissertations and Theses, http://hdl.handle.net/11375/25567
Project
GWF-SSSWQM: Sensors and Sensing Systems for Water Quality Monitoring|
PublicationType
Thesis
Year
2020
57 / 292
Publication 1.0
T-2024-12-19-v1HAxP1i3Ok2aUgw22i7WgQ
Abstract
In recent years, Deep Learning (DL) models have widely been applied to develop safety and security critical systems. The recent evolvement of Deep Neural Networks (DNNs) is the key reason behind the unprecedented achievements in image classification, object detection, medical image analysis, speech recog nition, and autonomous driving. However, DL models often remain a black box for their practitioners due to the lack of interpretability and explainability. DL practitioners generally use standard metrics such as Precision, Recall, and F1 score to evaluate the performance of DL models on the test dataset. However, as high-quality test data is not frequently accessed, the expected level of accuracy of these standard metrics on test datasets cannot justify the trustworthiness of testing adequacy, generality and robustness of DL models. The way we ensure the quality of DL models is still in its infancy; hence, a scalable DL model testing frame work is highly demanded in the context of soft ...
Authorship
Awal, Md. Abdul
Citation
Awal, Md. Abdul (2022) An Empirical Study on the Effectiveness of Testing Metrics to Test Deep Learning Models, USASK Harvest - Theses and Dissertations, https://hdl.handle.net/10388/13932
PublicationType
Thesis
Year
2022
58 / 292
Publication 1.0
T-2024-12-19-y1XbiKcy37vEWxvqigYy2T6iA
Abstract
Changes in the water cycle influence the energy balance of the Earth. The water cycle is represented using the water balance equation, in which Evapotranspiration (ET) is a vital parameter. One of the main drivers of the change in ET within a specific area is the change in land cover. This study focuses on estimating ET across the Upper Gundar River Basin located in the state of Tamil Nadu, India. Notable features of this landscape include agriculture throughout the year supported using an extensive network of tanks and borewells, and the presence of Prosopis juliflora, a widely prevalent invasive species known to consume groundwater and moisture. Due to the lack of spatial variability in point ET measurements, ET models using remote sensing imagery as the main forcing data have been widely used to assess the spatial variability and temporal variability based on the principle of surface energy balance. These models are collectively referred to as Surface Energy Balance (SEB) models. Th ...
Authorship
Senthilkumaran, Akash
Citation
Senthilkumaran, Akash (2024) An Evaluation of the Impact of Seasonal Land Cover Change on Evapotranspiration Estimates at the Catchment Scale in the Upper Gundar River Basin, Tamil Nadu, India, UWSpace - Theses, https://hdl.handle.net/10012/20481
PublicationType
Thesis
Year
2024
59 / 292
Publication 1.0
T-2022-12-05-T1whdOFJXFEKgKLY4enRFyQ
Abstract
Weather and climate are major factors influencing worldwide wildfire activity. This study assesses surface and atmospheric conditions associated with the 2014 extreme wildfires in the Northwest Territories (NWT) of Canada. Hot and dry conditions led to the NWT experiencing the most severe wildfire season in its recorded history. The season included a record number of cloud-to-ground lightning flashes and set a record for area burned. Lightning was the dominant ignition source and accounted for about 95% of the wildfires. Prolonged periods of smoke led to dramatic reductions in visibility, frequent road closures, and reduced air quality resulting in numerous health alerts. Temporal and spatial patterns of lightning characteristics in 2014, derived from Canadian Lightning Detection Network data, were different from those in other years with, for example, far more positive flashes from 0600 to 1200 utc (midnight to 6:00 am local time). The highest fraction of positive cloud-to-ground flas ...
Authorship
Kochtubajda, B., Stewart, R. E., Flannigan, M. D., Bonsal, B. R., Cuell, C., & Mooney, C. J.
Citation
Kochtubajda, B., Stewart, R. E., Flannigan, M. D., Bonsal, B. R., Cuell, C., & Mooney, C. J. (2019). An assessment of surface and atmospheric conditions associated with the extreme 2014 wildfire season in Canada's Northwest Territories. Atmosphere-Ocean, 57(1), 73-90. https://doi.org/10.1080/07055900.2019.1576023.
PublicationType
Journal Article
Year
2019
60 / 292
Publication 1.0
T-2023-01-21-61wlTMYImQUKuJ363I4i7N7w
Authorship
Yirdaw S.Z., K. R. Snelgrove, F. R. Seglenieks, C. O. Agboma and E.D. Soulis.
Citation
Yirdaw S.Z., K. R. Snelgrove, F. R. Seglenieks, C. O. Agboma and E.D. Soulis. (2009). An assessment of the WATCLASS hydrological model result of the Mackenzie River basin using the GRACE satellite total water storage measurement. Hydrological Processes pp3391-3400
PublicationType
Journal Article
Title
An assessment of the WATCLASS hydrological model result of the Mackenzie River basin using the GRACE satellite total water storage measurement
Year
2009
61 / 292
Publication 1.0
T-2024-10-30-91czUEc6w8k691rgzxkU4Jsw
Abstract
Eddy covariance (EC) is one of the most effective ways to directly observe evaporation from a lake surface. However, the deployment of EC systems on lakes is costly and technically challenging which engenders a need for accurate modelling of evaporation from reservoirs for effective management. This study aims to 1) refactor the Canadian Small Lakes Model (CSLM) into modern high-level programming languages in open-source repositories and 2) evaluate evaporation estimates from the CSLM using nine years of EC observations of a pit-lake in Northern Alberta. The CSLM is a 1-D physical lake model simulating a mixing layer and arbitrary thick skin layer which interfaces with the atmosphere and includes a module for ice dynamics. It was developed to interface with the Canadian Global Coupled models as part of the surface classification scheme, and thus utilizes widely accessible forcing data. In this study the CSLM evaporation estimates are also compared to a commonly used bulk transfer metho ...
Authorship
M. Graham Clark, Sean K. Carey
Citation
M. Graham Clark, Sean K. Carey (2024) An open source refactoring of the Canadian small lakes model for estimates of evaporation from medium sized reservoirs, EGUsphere Vol.2024 pg.1-24
PublicationType
Journal Article
Year
2024
62 / 292
Publication 1.0
T-2023-01-04-u1E3kvQ8e6ESu3lJBe0PZu2kw
Abstract
An ever-growing Canadian urban population could be severely impacted by increase in temperature. Canada’s mean temperature is projected to increase by 6-8°C towards the end of the 21st century. The consequence of rising temperatures is an increased likelihood of extreme temperature events like heatwaves and wildfires. The thesis aims to assess changes in extreme temperature in large Canadian urban areas. The research will help in developing mitigation measures like urban planning, which help cope with changing temperature extremes. Predicting urban temperature change will require rigorous assessment of climate models, to account for the uncertainty in projecting temperature in large urban agglomerates. CMIP6 ensemble of models, provide an opportunity for assessment of urban-based projections. The models however, would need to be of fine resolution to fully capture its variability since urban temperature is heavily influenced by local urban features that contribute to Urban heat island ...
Authorship
Gaddam Rohan
Citation
Gaddam Rohan , Analysis of Temperature extremes in Canadian Cities using CMIP6 Data, 2021.
Project
GWF-CORE: Core Modelling and Forecasting|
PublicationType
Thesis
Year
2021
63 / 292
Publication 1.0
T-2024-12-19-A16A1KTL5eHEyJWLK4VHJagg
Abstract
Wastewater treatment plants (WWTPs) are traditionally designed to target the removal of contaminants such as total suspended solids, phosphorous, biological oxygen demand, and ammonia. Recent changes to the Federal Wastewater Systems Effluent Regulations (WSER) in Canada require all WWTPs to be operating with secondary treatment or equivalent by 2021. Upgrades being implemented at WWTPs across the country will improve the quality of final effluent discharged into the receiving waters. However, over the past several years, contaminants of emerging concern such as pharmaceuticals, personal care products, and endocrine disrupting compounds have become widely prevalent in wastewater. These compounds are not monitored or targets for removal in Canada causing them to be routinely discharged into surface waters. The Grand River watershed is the largest watershed in southern Ontario and receives effluent discharge from 30 WWTPs. Several studies have been conducted in the Grand River to asse ...
Authorship
Srikanthan, Nivetha
Citation
Srikanthan, Nivetha (2019) Analysis of Temporal Changes in Estrogenic Compounds Released from Municipal Wastewater Treatment Plants, UWSpace - Theses, http://hdl.handle.net/10012/15167
PublicationType
Thesis
Year
2019
64 / 292
Publication 1.0
T-2024-08-19-M10OAW3YHS06GUtBoSdQE8Q
Authorship
Mutton, D., Arain, M.A, Davison B., Princz, D.
Citation
Mutton, D., Arain, M.A, Davison B., Princz, D. (2022) Analysis of carbon and water cycle variability in Canadian watersheds using coupled MESH-CLASSIC model. Assessing the impact of climate change on the McKenzie Creek in the Great Lakes region. Global Water Futures Annual Science Meeting, University of Saskatoon, Saskatoon, Saskatchewan, Canada (held virtually), May 16-18, 2022.
Project
GWF-SFWF: Southern Forests Water Futures|
PublicationType
Conference Presentation
Title
Analysis of carbon and water cycle variability in Canadian watersheds using coupled MESH-CLASSIC model. Assessing the impact of climate change on the McKenzie Creek in the Great Lakes region
Year
2022
65 / 292
Publication 1.0
T-2022-04-24-b3b1GZxMWL4ESpJk2mjLukZQ
Abstract
Recent advances in the Mod´elisation Environmentale Communautaire Surface and Hydrology system (MESH) allows for vector-based routing to better represent the reality of the catchment structure and water processes within the catchment. MESH has also been coupled with the Canadian Land Surface Scheme including Biogeochemical Cycles (CLASSIC) allows for the simulation of carbon, water, and energy cycles at a catchment scale. In this study, the MESH-CLASSIC model was tested in three catchments across Canada, the Groundhog River catchment (a Boreal Forest catchment in northern Ontario), the Big Creek catchment (a managed agricultural catchment in southern Ontario), and the White Gull Creek catchment (a boreal forest and wetland in northern Saskatchewan). The vector-based MESH-CLASSIC model simulations were performed for historic and future climate change scenarios, RCP 4.5 and 8.5. Model biases in simulating hydrological processes such as stream flow, evapotranspiration, snow mass, and soil ...
Authorship
Mutton Daniel, Arain M. Altaf, Davidson Bruce, Princz Daniel
Citation
Daniel Mutton, M. Altaf Arain, Bruce Davidson, Daniel Princz (2022). Analysis of coupled MESH-CLASSIC model performance in Canadian watersheds . Proceedings of the GWF Annual Open Science Meeting, May 16-18, 2022.
PublicationType
Conference Poster
Summary
Research uses coupled MESH-CLASSIC model to predict future carbon, water, and energy cycle in three watersheds across Canada
Title
Analysis of coupled MESH-CLASSIC model performance in Canadian watersheds
Year
2022
66 / 292
Publication 1.0
T-2024-12-19-f1y9f2PsJxh0uErkLyZf2v8SA
Abstract
Biomaterials used in biomedical implants, diagnostic devices, and in-situ sensors, all face the issue of biofouling. Surface modification of biomaterial surfaces with antifouling polymers can prevent non-specific adsorption of proteins and other bio-foulants onto these surfaces. Although there are many antifouling polymers to chose from, getting the polymers onto different materials is challenging as the surface modification process is dependent on the substrate’s surface chemistry. This limits the kinds of materials that are able to be modified, especially in devices made with several materials that must be modified as a single unit. Therefore, the goal of this research is to develop an effective antifouling surface modification that is compatible with different types and classes of biomaterials. A three-step modification approach was taken to form dense antifouling polymer brushes. The surfaces were first activated using oxygen plasma to increase the density of surface hydroxyl group ...
Authorship
Chau, Colleen
Citation
Chau, Colleen (2021) Antifouling Surface Modifications for Multiple Materials, MacSphere Open Access Dissertations and Theses, http://hdl.handle.net/11375/26229
PublicationType
Thesis
Year
2021
67 / 292
Publication 1.0
T-2022-04-24-o17Fo3Qo1wxrkyTSAtli2WBCw
Abstract
Ice jam formation is a key concern for many rivers in cold regions. Ice jams can lead to destructive floods during the ice season and create major disturbances in the aquatic environment. In the past years, numerous approaches, including numerical, empirical and data-driven models, have been applied to understand and potentially help reduce the detrimental impacts of ice-jam formation and flooding on riverine communities. Although these approaches are capable of solving many ice-related problems, they still have some limitations. Recent advancements in machine learning offers many methodological opportunities to deal with a plethora of data. This study explores the use of modelling output (e.g. hydrological and hydraulic model results and global circulation model (GCM) output) in various machine learning algorithms to predict river-ice hydraulic processes, such as ice-jam formation and mid-winter breakup along the Saint John River, which is a transboundary and transborder river in Nort ...
Authorship
Das Apurba, Kowshal Ananya, Budhathoki Sujata, and Lindenschmidt Karl-Erich
Citation
Apurba Das, Ananya Kowshal, Sujata Budhathoki and Karl-Erich Lindenschmidt (2022). Application of Machine Learning approaches in ice-jam flood forecasting and prediction. Proceedings of the GWF Annual Open Science Meeting, May 16-18, 2022.
Project
GWF-CORE: Core Modelling and Forecasting|
PublicationType
Conference Presentation
Year
2022
68 / 292
Publication 1.0
T-2022-12-03-K1bmx6HozHUaz8UgK3alBjSg
Abstract
Synthetic aperture radar (SAR) is a widely used tool for Earth observation activities. It is particularly effective during times of persistent cloud cover, low light conditions, or where in situ measurements are challenging. The intensity measured by a polarimetric SAR has proven effective for characterizing Arctic tundra landscapes due to the unique backscattering signatures associated with different cover types. However, recently, there has been increased interest in exploiting novel interferometric SAR (InSAR) techniques that rely on both the amplitude and absolute phase of a pair of acquisitions to produce coherence measurements, although the simultaneous use of both intensity and interferometric coherence in Arctic tundra image classification has not been widely tested. In this study, a time series of dual-polarimetric (VV, VH) Sentinel-1 SAR/InSAR data collected over one growing season, in addition to a digital elevation model (DEM), was used to characterize an Arctic tundra stud ...
Authorship
Merchant, M. A., Obadia, M., Brisco, B., DeVries, B., and Berg, A.
Citation
Merchant, M. A., Obadia, M., Brisco, B., DeVries, B., and Berg, A.: Applying Machine Learning and Time-Series Analysis on Sentinel-1A SAR/InSAR for Characterizing Arctic Tundra Hydro-Ecological Conditions, Remote Sensing, 14, 1123, https://doi.org/10.3390/rs14051123, 2022
Project
GWF-NWF: Northern Water Futures|
PublicationType
Journal Article
Year
2022
69 / 292
Publication 1.0
T-2022-12-03-z1z1NKcaJ9WUKiSsACtf30pw
Abstract
Causes of software architectural change are clas-
sified as perfective, preventive, corrective, and adaptive. Change
classification is used to promote common approaches for address-
ing similar changes, produce appropriate design documentation
for a release, construct a developer’s profile, form a balanced
team, support code review, etc. However, automated architectural
change classification techniques are in their infancy, perhaps due
to the lack of a benchmark dataset and the need for extensive
human involvement. To address these shortcomings, we present
a benchmark dataset and a text classifier for determining the
architectural change rationale from commit descriptions. First,
we explored source code properties for change classification
independent of project activity descriptions and found poor
outcomes. Next, through extensive analysis, we identified the
challenges of classifying architectural change from text and pro-
posed a new classifier that uses concept tokens derived from t ...
Authorship
Mondal AK, Roy B, Sumana SN and Schneider KA, ArchiNet
Citation
Mondal AK, Roy B, Sumana SN and Schneider KA, ArchiNet: A Concept-token based Approach for Determining Architectural Change Categories, The 33rd International Conference on Software Engineering & Knowledge Engineering (SEKE), KSIR Virtual Conference Center, Pittsburgh, USA, 2021. pp. 7-14.
Project
GWF-CS: Computer Science|
PublicationType
Journal Article
Year
2021
70 / 292
Publication 1.0
T-2024-09-25-Z1F5n9vSdoEuOpeseIVSgAg
Abstract
In Canada's Arctic tundra region, permafrost is continuous, and the landscape is rich in patterned features. Polygonal terrain, which includes both high- and low-centered features and their wet trenches below, is considered to be high-latitude wetlands in the continuous permafrost region. These prominent hydrological features retain and transport water within widespread ice-wedge networks and govern many ecosystem dynamics. Due to the meter-scale spatial gradients of these processes, mapping of polygonal wetland networks necessitates high-resolution imagery. To date, most studies have used optical imagery for this task; however, these sensors are affected by cloud cover and polar darkness, limiting image availability and repeatability. Thus, our overall objective was to evaluate high-resolution hybrid compact polarimetric (HCP) imagery from the recently launched Radarsat Constellation Mission (RCM), in fusion with ArcticDEM topographic data, for Arctic landscape mapping with a focus on ...
Authorship
Merchant, M., Bourgeau-Chavez, L., Mahdianpari, M., Brisco, B., Obadia, M., DeVries, B., Berg, A.
Citation
Merchant, M., Bourgeau-Chavez, L., Mahdianpari, M., Brisco, B., Obadia, M., DeVries, B., Berg, A. (2024) Arctic ice-wedge landscape mapping by CNN using a fusion of Radarsat constellation Mission and ArcticDEM, Remote Sensing of Environment, Vol 304, Pg 114052, Issn 0034-4257, https://doi.org/10.1016/j.rse.2024.114052
Project
GWF-NWF: Northern Water Futures|
PublicationType
Journal Article
Year
2024
71 / 292
Publication 1.0
T-2025-08-05-B1yWUfUB1XdE6TaF3x4ytvZA
Abstract
In recent decades, there has been a surge in the availability of precipitation datasets, each leveraging diverse data sources and sophisticated algorithms. However, the density of the gauged station network presents a substantial challenge in thoroughly assessing these datasets, particularly in regions with sparse coverage. This study seeks to quantify the observational uncertainty of precipitation across North America by introducing a novel framework. The framework is designed to detect potential outliers, categorize datasets based on their level of agreement, and operate at both monthly and daily time steps. Eleven datasets spanning from 2002 to 2017 are investigated: ANUSPLIN, CaPA, CHIRPS, CMORPH, DAYMET, ERA5, GSMaP, IMERG, MSWEP, PERSIANN and PRISM. Analyses at the grid-cell scale revealed that on average and across the entire domain, excluding outlier datasets reduced observational uncertainty by ~17% for the monthly time step and ~39% for the daily time step. Aggregating result ...
Authorship
Guilpart, E., Thériault, M. J., Di Luca, A., Roberge, F., and Picart, T.
Project
GWF-CPE: Climate-Related Precipitation Extremes|
PublicationType
Journal Article
Year
2025
72 / 292
Publication 1.0
T-2024-09-25-M18znpaSrbEKNxJ624ns8ww
Abstract
The seasonal temperature trends and ice phenology in the Great Slave Lake (GSL) are significantly influenced by inflow from the Slave River. The river undergoes a sequence of mechanical break-ups all the way to the GSL, initiating the GSL break-up process. Additionally, upstream water management practices impact the discharge of the Slave River and, consequently, the ice break-up of the GSL. Therefore, monitoring the break-up process at the Slave River Delta (SRD), where the river meets the lake, is crucial for understanding the cascading effects of upstream activities on GSL ice break-up. This research aimed to use Random Forest (RF) models to monitor the ice break-up processes at the SRD using a combination of satellite images with relatively high spatial resolution, including Landsat-5, Landsat-8, Sentinel-2a, and Sentinel-2b. The RF models were trained using selected training pixels to classify ice, open water, and cloud. The onset of break-up was determined by data-driven thresho ...
Authorship
Moalemi, I., Kheyrollah Pour, H., Scott, K.A.
Citation
Moalemi, I., Kheyrollah Pour, H., Scott, K.A. (2024) Assessing Ice Break-Up Trends in Slave River Delta through Satellite Observations and Random Forest Modeling, Remote Sensing, https://doi.org/10.3390/rs16122244
Project
GWF-Remotely Sensed Monitoring of Northern Lake Ice Using RADARSAT Constellation Mission and Cloud Computing|
PublicationType
Journal Article
Year
2024
73 / 292
Publication 1.0
T-2022-12-03-n2n1IbPdROeEyaB9HtHXVH8g
Abstract
Significant challenges from changes in climate and land use face sustainable water use in the Canadian Prairies ecozone. The region has experienced significant warming since the mid-20th century, and continued warming of an additional 2 ∘C by 2050 is expected. This paper aims to enhance understanding of climate controls on Prairie basin hydrology through numerical model experiments. It approaches this by developing a basin-classification-based virtual modelling framework for a portion of the Prairie region and applying the modelling framework to investigate the hydrological sensitivity of one Prairie basin class (High Elevation Grasslands) to changes in climate. High Elevation Grasslands dominate much of central and southern Alberta and parts of south-western Saskatchewan, with outliers in eastern Saskatchewan and western Manitoba. The experiments revealed that High Elevation Grassland snowpacks are highly sensitive to changes in climate but that this varies geographically. Spring maxi ...
Authorship
Spence, C., He, Z., Shook, K. R., Mekonnen, B. A., Pomeroy, J. W., Whitfield, C. J., & Wolfe, J. D.
Citation
Spence, C., He, Z., Shook, K. R., Mekonnen, B. A., Pomeroy, J. W., Whitfield, C. J., & Wolfe, J. D. (2022). Assessing hydrological sensitivity of grassland basins in the Canadian Prairies to climate using a basin classification-based virtual modelling approach. Hydrology and Earth System Sciences. 26, 1801-1819. https://doi.org/10.5194/hess-26-1801-2022
Project
GWF-PW: Prairie Water|
PublicationType
Journal Article
Title
Assessing hydrological sensitivity of grassland basins in the Canadian Prairies to climate using a basin classification-based virtual modelling approach
Year
2022
74 / 292
Publication 1.0
T-2023-05-24-Z1N1TMdjDrkO5PBRQrZ1wdyg
Abstract
Wetland drainage has been pervasive in the North American Prairie Pothole Region. There is strong evidence that this drainage increases the hydrological connectivity of previously isolated wetlands and, in turn, runoff response to snowmelt and rainfall. It can be hard to disentangle the role of climate from the influence of wetland drainage in observed records. In this study, a basin-classification-based virtual modelling approach is described that can isolate these effects on runoff regimes. The basin class which was examined, entitled Pothole Till, extends throughout much of Canada's portion of the Prairie Pothole Region. Three knowledge gaps were addressed. First, it was determined that the spatial pattern in which wetlands are drained has little influence on how much the runoff regime was altered. Second, no threshold could be identified below which wetland drainage has no effect on the runoff regime, with drainage thresholds as low as 10 % in the area being evaluated. Third, wette ...
Authorship
Spence, C., He, Z., Shook, K. R., Pomeroy, J. W., Whitfield, C. J., and Wolfe, J. D.
Citation
Spence, C., He, Z., Shook, K. R., Pomeroy, J. W., Whitfield, C. J., and Wolfe, J. D. (2022). Assessing runoff sensitivity of North American Prairie Pothole Region basins to wetland drainage using a basin classification-based virtual modelling approach, Hydrol. Earth Syst. Sci., 26, 5555-5575, https://doi.org/10.5194/hess-26-5555-2022
Project
GWF-PW: Prairie Water|
PublicationType
Journal Article
Title
Assessing runoff sensitivity of North American Prairie Pothole Region basins to wetland drainage using a basin classification-based virtual modelling approach
Year
2022
75 / 292
Publication 1.0
T-2025-08-08-q1Lk2lxLK0UClra2lq38OvLw
Abstract
The importance of trees in non-forest landscapes has been the focus of only a few studies. However, these trees provide many important ecosystem services. In this study, we mapped and quantified these trees using Sentinel-2 (S2) and very high-resolution (VHR) Google satellite imagery without any field campaigns. We performed a Random Forest (RF) classification to map the spatial distribution of native trees in different scenarios. The optimal model showed an overall accuracy and kappa of 0.99 and 0.98, respectively. We mapped 40,500 km2 of tree cover, including native tree cover (approximately 29,565 km2 ≈10.5%), excluding plantations, regional and provincial parks, and water bodies in the Canadian prairie region of Saskatchewan. According to our results, the highest numbers of native trees were found in the eastern and northwestern parts of the study area – cluster “BLK_1” and the “Black” soil zone, with total cover of 5,388 and 13,233 km2, respectively. The lowest numbers of native t ...
Authorship
Shafeian, B., Mood, B. J., Belcher, K. W., & Laroque, C. P.
Project
GWF-PW: Prairie Water|
PublicationType
Journal Article
Year
2024
76 / 292
Publication 1.0
T-2024-09-25-L1XlqGJR2F0m7true1DZpvA
Abstract
Climate change presents unique challenges for grape growers across the world. In Ontario, three distinct viticultural regions are experiencing climatic shifts towards warmer growing seasons. According to historical records collected from Environment and Climate Change Canada, Lake Erie North Shore has transitioned from an intermediate-to-warm growing season classification, the Niagara Peninsula from the lower to upper limits of the intermediate zone, and Prince Edward County from cool to intermediate, when analyzing their average growing season temperatures. Terroir is directly related to vine water status, an indicator of grapevine stress. Biophysical responses controlled by air temperature and precipitation include fluctuations in vapour pressure deficits, evapotranspiration, and water-use-efficiency rates, as well as soil water content levels. By conducting an extensive literature review, the development of a conceptual model addresses how variations in climatic controls, under the ...
Authorship
Williamson, J., Petrone, R.M., Valentini, R., Macrae, M., Reynolds, A.
Citation
Williamson, J., Petrone, R.M., Valentini, R., Macrae, M., Reynolds, A. (2024) Assessing the influence of climate controls on grapevine biophysical responses: a review of Ontario viticulture in a changing climate, Canadian Journal of Plant Science, https://doi.org/10.1139/cjps-2023-0161
Project
GWF-AWF: Agricultural Water Futures|
PublicationType
Journal Article
Year
2024
77 / 292
Publication 1.0
T-2024-12-19-I15krJieM9UI2I1hYoHbTx0sA
Abstract
Lakes are regarded as sentinels of change, where shifts in environmental conditions significantly affect lake phenology. A significant consequence of the change is the perceived increase in the frequency, magnitude, and severity of algal blooms in lakes globally. Algal blooms/increased productivity in lakes pose significant ecological, economic and health risks, impacting fisheries, tourism, and freshwater access. The impacts of external nutrient loading from anthropogenic sources are well documented; however, blooms have been observed to occur in even remote lakes. Climate change is a hypothesized driver of these recent algal bloom trends, such as increasing global air temperatures, water temperatures, lake ice loss, precipitation intensity, and drought. Past research on the impact of climatic drivers on algal biomass dynamics has often been limited to lab, mesocosm, or short termed observations, due to limited in situ data. New remote sensing data products make use of historic multis ...
Authorship
Dallosch, Michael
Citation
Dallosch, Michael (2024) Assessment of Drivers of Algal Biomass in North American Great Lakes via Satellite Remote Sensing, UWSpace - Theses, https://hdl.handle.net/10012/20412
PublicationType
Thesis
Year
2024
78 / 292
Publication 1.0
T-2021-11-14-l15nzhijfikl2Ikl1DGirokvQ
Abstract
Global gridded precipitation products have proven essential for many applications ranging from hydrological modeling and climate model validation to natural hazard risk assessment. They provide a global picture of how precipitation varies across time and space, specifically in regions where ground-based observations are scarce. While the application of global precipitation products has become widespread, there is limited knowledge on how well these products represent the magnitude and frequency of extreme precipitation—the key features in triggering flood hazards. Here, five global precipitation datasets (MSWEP, CFSR, CPC, PERSIANN-CDR, and WFDEI) are compared to each other and to surface observations. The spatial variability of relatively high precipitation events (tail heaviness) and the resulting discrepancy among datasets in the predicted precipitation return levels were evaluated for the time period 1979–2017. The analysis shows that 1) these products do not provide a consistent r ...
Authorship
Rajulapati, C. R., Papalexiou, S. M., Clark, M. P., Razavi, S., Tang, G., & Pomeroy, J. W.
Citation
Rajulapati, C. R., Papalexiou, S. M., Clark, M. P., Razavi, S., Tang, G., & Pomeroy, J. W. (2020). Assessment of Extremes in Global Precipitation Products: How Reliable Are They? Journal of Hydrometeorology, 21(12), 2855-2873. https://doi.org/10.1175/JHM-D-20-0040.1
Project
GWF-Paradigm Shift in Downscaling Climate Model Projections|
PublicationType
Journal Article
Year
2020
79 / 292
Publication 1.0
T-2021-11-14-y1aKc3i6IUkqnuofYMap9LA
Abstract
The topic of satellite remote sensing of lake ice has gained considerable attention in recent years. Optical satellite data from the Moderate Resolution Imaging Spectroradiometer (MODIS) allow for the monitoring of lake ice cover (an Essential Climate Variable or ECV), and dates associated with ice phenology (freeze-up, break-up, and ice cover duration) over large areas in an era where ground-based observational networks have nearly vanished in many northern countries. Ice phenology dates as well as dates of maximum and minimum ice cover extent (for lakes that do not form a complete ice cover in winter or do not totally lose their ice cover in summer) are useful for assessing long-term trends and variability in climate, particularly due to their sensitivity to changes in near-surface air temperature. Existing knowledge-driven (threshold-based) retrieval algorithms for lake ice cover mapping that use top-of-atmosphere (TOA) reflectance products do not perform well under lower solar illu ...
Authorship
Wu, Y., Duguay, C. R., & Xu, L.
Citation
Wu, Y., Duguay, C. R., & Xu, L. (2021). Assessment of machine learning classifiers for global lake ice cover mapping from MODIS TOA reflectance data. Remote Sensing of Environment, 253, 112206. https://doi.org/10.1016/j.rse.2020.112206 .
Project
GWF-TSTSW: Transformative Sensor Technologies and Smart Watersheds|
PublicationType
Journal Article
Title
Assessment of machine learning classifiers for global lake ice cover mapping from MODIS TOA reflectance data
Year
2021
80 / 292
Publication 1.0
T-2023-01-21-41IHIsnG9wUO39RU41H6rzFQ
Authorship
Yirdaw, S.Z., Snelgrove, K.R., Seglenieks, F.R., Agboma, C.O. and Soulis, E.D.
Citation
Yirdaw, S.Z., Snelgrove, K.R., Seglenieks, F.R., Agboma, C.O. and Soulis, E.D. (2009). Assessment of the WATCLASS Hydrological Model Result of the Mackenzie River Basin Using the GRACE Satellite Total Water Storage Measurement. Hydrologic Processes, https://doi.org/10.1002/hyp.7450.
PublicationType
Journal Article
Title
Assessment of the WATCLASS Hydrological Model Result of the Mackenzie River Basin Using the GRACE Satellite Total Water Storage Measurement
Year
2009
81 / 292
Publication 1.0
T-2023-01-21-f1p5pU5EMKkaJr8FDf3J0DkQ
Authorship
Yirdaw, S.Z., K.R. Snelgrove, F.R. Seglenieks, C.O. Agboma, and E.D. Soulis
Citation
Yirdaw, S.Z., K.R. Snelgrove, F.R. Seglenieks, C.O. Agboma, and E.D. Soulis, 2009: Assessment of the WATCLASS hydrological model result of the MacKenzie River Basin using the result of the GRACE satellite total water storage measurement. Hydrol. Processes, 23, 3391-3400.
PublicationType
Conference Proceeding
Title
Assessment of the WATCLASS hydrological model result of the MacKenzie River Basin using the result of the GRACE satellite total water storage measurement
Year
2009
82 / 292
Publication 1.0
T-2022-12-05-n15Jb3PiL5km4SxG6TDfkew
Abstract
When a programmer makes changes to a target program entity (files, classes, methods), it is important to identify which other entities might also get impacted. These entities constitute the impact set for the target entity. Association rules have been widely used for discovering the impact sets. However, such rules only depend on the previous co-change history of the program entities ignoring the fact that similar entities might often need to be updated together consistently even if they did not co-change before. Considering this fact, we investigate whether cloning relationships among program entities can be associated with association rules to help us better identify the impact sets. In our research, we particularly investigate whether the impact set detection capability of a clone detector can be utilized to enhance the capability of the state-of-the-art association rule mining technique, Tarmaq, in discovering impact sets. We use the well known clone detector called NiCad in our in ...
Authorship
Mondal, M., Roy, B., Roy, C. K., & Schneider, K. A.
Citation
Mondal, M., Roy, B., Roy, C. K., & Schneider, K. A. (2020a). Associating Code Clones with Association Rules for Change Impact Analysis. In 2020 IEEE 27th International Conference on Software Analysis, Evolution and Reengineering (SANER) (pp. 93-103). IEEE. https://doi.org/10.1109/SANER48275.2020.9054846
PublicationType
Journal Article
Year
2020
83 / 292
Publication 1.0
T-2025-08-16-41r3c5427KTk2cAQGmjfOHlg
Abstract
Repeatable methods capable of quantifying Arctic surface water extent at high resolutions are important, but still require development. Here, we present a study using very-high resolution (VHR) X-band Synthetic Aperture Radar (SAR) imagery from Capella Space for fine-scale semantic segmentation of Arctic surface water features. Our study proposes a modified U-Net encoder-decoder model for this task, optimized using the Nadam algorithm. Otsu thresholding was leveraged to rapidly generate 512 × 512-pixel patches for the U-Net, resulting in an efficient and automated training pipeline. Within this study, we also quantitatively compared the deep learning (DL) U-Net to a shallow machine learning (ML) algorithm, XGBoost (XGB), and evaluated the Capella Space imagery against spatially and temporally coincident Sentinel-1 C-band. Performance evaluations showed the U-Net outperforms XGB measured under several statistical metrics, reaching an Intersection over Union (IoU) of 0.955. An explainabi ...
Authorship
Merchant, M. A., Mahdianpari, M., Bourgeau-Chavez, L., DeVries, B., & Berg, A.
Project
GWF-NWF: Northern Water Futures|
PublicationType
Journal Article
Year
2025
84 / 292
Publication 1.0
T-2021-11-14-g10ClxJRg3X0CyWZaukg2rg1bw
Abstract
Simulation-optimization techniques in support of groundwater management are computationally expensive. To tackle such computational burden, a variety of surrogate modeling-frameworks have been proposed, where a cheaper-to-run model referred to as a surrogate is used in lieu of a computationally intensive model. These frameworks are generally based on what referred herein to as ‘global surrogate modelling’ where a single surrogate approximates the underlying response surface of a model. Such classic frameworks, however, are sub-optimal when the response surface is complex and/or high-dimensional. This paper proposes a novel ‘local surrogate modelling’ framework that simultaneously builds and evolves multiple local surrogates, guided by an automatic clustering method. Unlike traditional clustering methods that select the number of clusters a priori, the proposed automatic clustering method concurrently determines the optimum number of clusters and the clustering scheme itself. To serve a ...
Authorship
Vali, M., Zare, M., & Razavi, S.
Citation
Vali, M., Zare, M., & Razavi, S. (2020). Automatic clustering-based surrogate-assisted genetic algorithm for groundwater remediation system design. Journal of Hydrology, 125752. https://doi.org/10.1016/j.jhydrol.2020.125752
Project
GWF-IMPC: Integrated Modelling Program for Canada|
PublicationType
Journal Article
Year
2020
85 / 292
Publication 1.0
T-2022-12-03-X1HOp2g8kYkqn0X3W9lt0shw
Abstract
Release notes are admitted as an essential technical document in software maintenance. They summarize the main changes, e.g. bug fixes and new features, that have happened in the software since the previous release. Manually producing release notes is a time-consuming and challenging task. For that reason, sometimes developers neglect to write release notes. For example, we collect data from GitHub with over 1900 releases, and among them, 37% of the release notes are empty. To mitigate this problem, we propose an automatic release notes generation approach by applying the text summarization techniques, i.e. TextRank. To improve the keyword extraction method of traditional TextRank, we integrate the GloVe word embedding technique with TextRank. After generating release notes automatically, we apply machine learning algorithms to classify the release note contents (or sentences). We classify the contents into six categories, e.g. bug fixes and performance improvements, to represent the r ...
Authorship
Nath SS, and Roy B
Citation
Nath SS, and Roy B, Automatically generating release notes with content classification models, International Journal of Software Engineering and Knowledge Engineering, 31(11n12):1721-1740, 2021.
Project
GWF-CS: Computer Science|
PublicationType
Journal Article
Title
Automatically generating release notes with content classification models
Year
2021
86 / 292
Publication 1.0
T-2022-12-03-E1ca61waz3E1mATm41gcRvE2g
Abstract
Beaver (Castor canadensis and Castor fiber) are regarded widely as ecosystem engineers and the dams they create are well-known for their ability to drastically alter the hydrology of rivers. As a result, beaver are increasingly being included in green infrastructure practices to combat the effects of climate change and enhance ecosystem resilience. Both drought and flood mitigation capabilities have been observed in watersheds with beaver dam structures; however, how dams possess contrasting mitigation abilities is not fully understood since most studies neglect to acknowledge variation in beaver dam structures. In this study, an extensive cross-site survey of the physical and hydrologic properties of beaver dams was conducted in the Canadian Rocky Mountains in Alberta. This research aimed to improve the understanding of the hydrology of beaver dams by categorizing dams using their intrinsic properties and landscape settings to identify fundamental patterns that may be applicable acros ...
Authorship
Ronnquist, A.L., and Westbrook, C.J.
Citation
Ronnquist, A.L., and Westbrook, C.J. 2021. Beaver dams: how structure, flow state, and landscape setting regulate water storage and release. Science of the Total Environment, 785: 147333, https://doi.org/10.1016/j.scitotenv.2021.147333.
Project
GWF-MWF: Mountain Water Futures|
PublicationType
Journal Article
Year
2021
87 / 292
Publication 1.0
T-2024-07-22-O1xIx4YJDA0yb0gp7UD80Mw
Abstract
In Arctic-boreal regions, climate change induced permafrost thaw causes complex interactions between topography, microbiology, hydrology and vegetation distribution that impact the emission rate of radiatively important gasses like methane (CH4). Vegetation distribution, for example, can be used as a proxy for permafrost thaw and the greenhouse gas emissions associated with each stage. To scale emissions up from the site level, more accurate remotely sensed data is needed to produce the necessary vegetation cover maps. Analyses of data collected from unpiloted aerial systems (UAS) have proven effective at classifying vegetation distribution into land cover classes that often include multiple species. However, focusing classification at the level of species functional group (SFG) could further improve scaling efforts by representing vegetation distribution, and thus permafrost thaw impacts and gas emissions, more accurately. High resolution, UAS-derived, hyperspectral imagery was collec ...
Authorship
Burke, S.A., Palace, M.W., Sullivan, F., et al.
Citation
Burke, S.A., Palace, M.W., Sullivan, F., et al. (2022) Beyond what the eye can see: using high-resolution UAS-derived hyperspectral imagery to classify boreal peatland vegetation. American Geophysical Meeting, Chicago, United States of America, (December 12-16). https://agu.confex.com/agu/fm22/meetingapp.cgi/Paper/1148519
Project
GWF-NWF: Northern Water Futures|
PublicationType
Conference Poster
Title
Beyond what the eye can see: using high-resolution UAS-derived hyperspectral imagery to classify boreal peatland vegetation
Year
2022
88 / 292
Publication 1.0
T-2025-09-12-71wXp71gS1yUqcm72YVmXmaJg
Abstract
Satellites are designed to monitor geospatial data over large areas at a catchment scale. However, most of satellite validation works are conducted at local point scales with a lack of spatial representativeness. Although upscaling them with a spatial average of several point data collected in the field, it is almost impossible to reorganize backscattering responses at pixel scales. Considering the influence of soil storage on watershed streamflow, we thus suggested watershed-scale hydrological validation. In addition, to overcome the limitations of backscattering models that are widely used for C-band Synthetic Aperture Radar (SAR) soil moisture but applied to bare soils only, in this study, RADARSAT-2 soil moisture was stochastically retrieved to correct vegetation effects arising from agricultural lands. Roughness-corrected soil moisture retrievals were assessed at various spatial scales over the Brightwater Creek basin (land cover: crop lands, gross drainage area: 1540 km2) in Sask ...
Authorship
Lee, J. H., & Lindenschmidt, K.-E.
PublicationType
Journal Article
Year
2023
89 / 292
Publication 1.0
T-2025-10-26-W10dr9nq14kuxUkwYtwosqw
Abstract
Increased loading of nitrogen and phosphorus from agricultural and urban intensification has led to severe degradation of inland and coastal waters. Lakes, reservoirs, wetlands, and streams retain and transform these nutrients, thus regulating their delivery to downstream waters. While the processes controlling nitrogen and phosphorus removal from the water column are relatively well-known, there is a lack of quantitative understanding of how these processes manifest across spatial scales.
This thesis explores the relationship between hydrologic and biogeochemical controls on nutrient processing in a lentic water body (lakes, reservoirs, and wetlands). Here, our work revolves around three research questions: 1) What are the emergent patterns between nutrient processing rates and residence times in lentic systems? 2) What are the underlying mechanisms contributing to the observed patterns? 3) What is the relative magnitude of nutrient retention as a function of wetland size? These ques ...
Authorship
Cheng, F.
Project
GWF-LF: Lake Futures|
PublicationType
Thesis
Year
2017
90 / 292
Publication 1.0
T-2023-05-28-R10YjUYZUh0KaOCR2GZkaxrA
Abstract
Flow management has the potential to significantly affect ecosystem condition. Shallow lakes in arid regions are especially susceptible to flow management changes, which can have important implications for the formation of cyanobacterial blooms. Here, we reveal water quality shifts associated with changing source water inflow management. Using in situ monitoring data, we studied a seven-year time span during which inflows to a shallow, eutrophic drinking water reservoir transitioned from primarily natural landscape runoff (2014–2015) to managed flows from a larger upstream reservoir (Lake Diefenbaker; 2016–2020) and identified significant changes in cyanobacteria (as phycocyanin) using generalized additive models to classify cyanobacterial bloom formation. We then connected changes in water source with shifts in chemistry and the occurrence of cyanobacterial blooms using principal components analysis. Phycocyanin was greater in years with managed reservoir inflow from a mesotrophic ups ...
Authorship
Painter, K.J., Venkiteswaran, J.J., and Baulch, H.M.
Citation
Painter, K.J., Venkiteswaran, J.J., and Baulch, H.M. (2023). Blooms and flows: Effects of variable hydrology and management on reservoir water quality. Ecosphere, 14, 3, e4472 https://doi.org/10.1002/ecs2.4472
Project
GWF-FORMBLOOM: Forecasting Tools and Mitigation Options for Diverse Bloom-Affected Lakes|
PublicationType
Journal Article
Year
2023
91 / 292
Publication 1.0
T-2024-10-25-X1kaE9ZtJ2U2X1NNY2q18Dow
Abstract
The Global Water Futures program (GWF) was granted $77.8 million by the Canada First Research Excellence Fund to conduct research on the forecasting and management of water futures in Canada as part of an effort to combat projected risks associated with global climate change. The production of scientific knowledge is a clear objective of the GWF program, and the evaluation and enumeration of research outcomes is a key metric. The goal of this work is to create a comprehensive bibliographic analysis of research outputs across the full extent of the GWF program including metadata such as the title, author, publication date and geographic locations of the works. Processes to incorporate quality control, classification and validation were documented to ensure these outputs are effectively managed, monitored and evaluated. Links to the resources are also made available to ensure they are easily accessible to a wide range of audiences. Enhanced accessibility is key in sharing critical climat ...
Authorship
Eager, S., Persaud, B.D., Goucher, N., Grant, J., Behbooei, M., Dukacz, K., Van Cappellen, P., Lin, J., Adapa, P.
Citation
Eager, S., Persaud, B.D., Goucher, N., Grant, J., Behbooei, M., Dukacz, K., Van Cappellen, P., Lin, J., Adapa, P. (2023). Breaking Down Barriers: Examining the Accessibility of Global Water Futures Research. 2023 Global Water Futures Annual Meeting, Saskatoon, Saskatchewan, May 15-17, 2023 http://hdl.handle.net/10012/19499 Conference Presentation
Project
GWF-KM: Knowledge Mobilization|
PublicationType
Conference Poster
Year
2023
92 / 292
Publication 1.0
T-2022-12-05-a18q9hga39HUmKyWT1oY0GSw
Abstract
The design and maintenance of APIs (Application Programming Interfaces) are complex tasks due to the constantly changing requirements of their users. Despite the efforts of their designers, APIs may suffer from a number of issues (such as incomplete or erroneous documentation, poor performance, and backward incompatibility). To maintain a healthy client base, API designers must learn these issues to fix them. Question answering sites, such as Stack Overflow (SO), have become a popular place for discussing API issues. These posts about API issues are invaluable to API designers, not only because they can help to learn more about the problem but also because they can facilitate learning the requirements of API users. However, the unstructured nature of posts and the abundance of non-issue posts make the task of detecting SO posts concerning API issues difficult and challenging. In this paper, we first develop a supervised learning approach using a Conditional Random Field (CRF), a statis ...
Authorship
Ahasanuzzaman, M., Asaduzzaman, M., Roy, C. K., & Schneider, K. A.
Citation
Ahasanuzzaman, M., Asaduzzaman, M., Roy, C. K., & Schneider, K. A. (2020). CAPS: a supervised technique for classifying Stack Overflow posts concerning API issues. Empirical Software Engineering, 25(2), 1493-1532. https://doi.org/10.1007/s10664-019-09743-4
PublicationType
Journal Article
Title
CAPS: a supervised technique for classifying Stack Overflow posts concerning API issues
Year
2020
93 / 292
Publication 1.0
T-2023-11-06-y1NLj9kCWDU6y3wmZJCVbqgA
Abstract
Permafrost thaw/degradation in the Northern Hemisphere due to global warming is projected to accelerate in coming decades. Assessment of this trend requires improved understanding of the evolution and dynamics of permafrost areas. Land surface models (LSMs) are well-suited for this due to their physical basis and large-scale applicability. However, LSM application is challenging because (a) LSMs demand extensive and accurate meteorological forcing data, which are not readily available for historic conditions and only available with significant biases for future climate, (b) LSMs possess a large number of model parameters, and (c) observations of thermal/hydraulic regimes to constrain those parameters are severely limited. This study addresses these challenges by applying the MESH-CLASS modeling framework (Modélisation Environmenntale communautaire—Surface et Hydrology embedding the Canadian Land Surface Scheme) to three regions within the Mackenzie River Basin, Canada, under various me ...
Authorship
Abdelhamed, M. S., Elshamy, M., Razavi, S., Wheater, H. S.
Citation
Abdelhamed, M. S., Elshamy, M., Razavi, S., Wheater, H. S. (2023) Challenges in Hydrologic-Land Surface Modeling of Permafrost Signatures—A Canadian Perspective, In Journal of Advances in Modeling Earth Systems, Volume 15, Issue 3. American Geophysical Union (AGU), https://doi.org/10.1029/2022ms003013
Project
GWF-AWF: Agricultural Water Futures|GWF-IMPC: Integrated Modelling Program for Canada|
PublicationType
Journal Article
Year
2023
94 / 292
Publication 1.0
T-2022-02-23-L1WpBhXarn0OvPbL3HFYcxcw
Abstract
Permafrost plays an important role in the hydrology of arctic/subarctic regions. However, permafrost thaw/degradation has been observed over recent decades in the Northern Hemisphere and is projected to accelerate. Hence, understanding the evolution of permafrost areas is urgently needed. Land surface models (LSMs) are well-suited for predicting permafrost dynamics due to their physical basis and large-scale applicability. However, LSM application is challenging because of the large number of model parameters and the complex memory of state variables. Significant interactions among the underlying processes and the paucity of observations of thermal/hydraulic regimes add further difficulty. This study addresses the challenges of LSM application by evaluating the uncertainty due to meteorological forcing, assessing the sensitivity of simulated permafrost dynamics to LSM parameters, and highlighting issues of parameter identifiability. Modelling experiments are implemented using the MESH- ...
Authorship
Abdelhamed, M.S., Elshamy, M., Razavi, S. and Wheater, H.
Citation
Abdelhamed, M.S., Elshamy, M., Razavi, S. and Wheater, H., 2022. Challenges in hydrologic-land surface modelling of permafrost signatures-Impacts of parameterization on model fidelity under the uncertainty of forcing. https://doi.org/10.1002/essoar.10510317.1
Project
GWF-CORE: Core Modelling and Forecasting|
PublicationType
Journal Article
Year
2022
95 / 292
Publication 1.0
T-2024-12-19-x10yVdn6vx1E6XZtcm80WSoQ
Abstract
Human-induced disturbances of terrestrial and aquatic ecosystems continue at alarming rates. With the advent of both raw sensor and analysis-ready datasets, the need to monitor ecosystem disturbances is now more imperative than ever; yet the task is becoming increasingly complex with increasing sources and varieties of earth observation data. In this research, computer vision methods and tools are interrogated to understand their capability for comparing spatial patterns. A critical survey of literature provides evidence that computer vision methods are relatively robust to scale and highlights issues involved in parameterization of computer vision models for characterizing significant pattern information in a geographic context. Utilizing two widely used pattern indices to compare spatial patterns in simulated and real-world datasets revealed their potential to detect subtle changes in spatial patterns which would not otherwise be feasible using traditional pixel-level techniques. A t ...
Authorship
Malik, K.
Citation
Malik, Karim (2021) Change detection and landscape similarity comparison using computer vision methods, Scholars Commons Laurier - Theses and Dissertations, https://scholars.wlu.ca/etd/2406
PublicationType
Thesis
Year
2021
96 / 292
Publication 1.0
T-2022-12-03-e12UK5Nzcz0yX8bDxzpQpHw
Abstract
Projections of change in high-flow extremes with global warming vary widely among, and within, large midlatitude river basins. The spatial variability of these changes is attributable to multiple causes. One possible and little-studied cause of changes in high-flow extremes is a change in the synchrony of mainstem and tributary streamflow during high-flow extremes at the mainstem-tributary confluence. We examined reconstructed and simulated naturalized daily streamflow at confluences on the Columbia River in western North America, quantifying changes in synchrony in future streamflow projections and estimating the impact of these changes on high-flow extremes. In the Columbia River basin, projected flow regimes across colder tributaries initially diverge with warming as they respond to climate change at different rates, leading to a general decrease in synchrony, and lower high-flow extremes, relative to a scenario with no changes in synchrony. Where future warming is sufficiently larg ...
Authorship
Rupp, D. E., Chegwidden, O. S., Nijssen, B., & Clark, M. P.
Citation
Rupp, D. E., Chegwidden, O. S., Nijssen, B., & Clark, M. P. (2021). Changing River Network Synchrony Modulates Projected Increases in High Flows. Water Resources Research, 57(4). https://doi.org/10.1029/2020WR028713
Project
GWF-CORE: Core Modelling and Forecasting|
PublicationType
Journal Article
Year
2021
97 / 292
Publication 1.0
T-2024-12-19-L16WL2C041L3kqfkEKfKwXDdA
Abstract
The microbiome has been described as an additional host “organ” with well-established beneficial roles. In addition to aiding in digestion of food and uptake of nutrients, microbiota in guts of vertebrates are responsible for regulating several beneficial functions, including stimulating immune responses and maintaining homeostasis. However, effects of exposures to chemicals on both structure and function of the gut microbiome of fishes are understudied. The overall purpose of research reported in this thesis was to characterize the effects of polycyclic aromatic hydrocarbons (PAHs) on the gut microbiomes of freshwater fishes, using both laboratory- and field-based assessments. PAHs have a number of well-characterized deleterious impacts in fish and are known modulators of the aryl hydrocarbon receptor, a receptor that has a bidirectional relationship with the microbiome. As such, this chemical class was selected to investigate targeted effects on the microbiome. The objectives of this ...
Authorship
DeBofsky, Abigail
Citation
DeBofsky, Abigail (2020) Characterization of the impacts of polycyclic aromatic hydrocarbons on the fish gut microbiome, USASK Harvest - Theses and Dissertations, http://hdl.handle.net/10388/13038
PublicationType
Thesis
Year
2020
98 / 292
Publication 1.0
T-2023-02-08-X1LO38pxX1zU2DFlGZp8bskg
Abstract
The microbiome has been described as an additional host “organ” with well-established beneficial roles. In addition to aiding in digestion of food and uptake of nutrients, microbiota in guts of vertebrates are responsible for regulating several beneficial functions, including stimulating immune responses and maintaining homeostasis. However, effects of exposures to chemicals on both structure and function of the gut microbiome of fishes are understudied. The overall purpose of research reported in this thesis was to characterize the effects of polycyclic aromatic hydrocarbons (PAHs) on the gut microbiomes of freshwater fishes, using both laboratory- and field-based assessments. PAHs have a number of well-characterized deleterious impacts in fish and are known modulators of the aryl hydrocarbon receptor, a receptor that has a bidirectional relationship with the microbiome. As such, this chemical class was selected to investigate targeted effects on the microbiome. The objectives of this ...
Authorship
DeBofsky, Abigail
Citation
DeBofsky, Abigail (2020). Characterization of the impacts of polycyclic aromatic hydrocarbons on the fish gut microbiome. https://harvest.usask.ca/handle/10388/13038 http://hdl.handle.net/10388/13038
Project
GWF-NGS: Next Generation Solutions for Healthy Water Resources|
PublicationType
Thesis
Year
2020
99 / 292
Publication 1.0
T-2023-01-14-41N2UvFCKgUyOHnmnsFptaA
Authorship
Kershaw, G. G. L.
Citation
Kershaw, G. G. L. (2020). Characterizing alpine basin land cover classes and their influence on water storage and routing in the Mackenzie Mountains, Kaska & Shúhtaot'ine shared territory. University of Guelph GEG Brown Bag Speakers Series. Guelph, ON, Canada.
Project
GWF-NWF: Northern Water Futures|
PublicationType
Conference Presentation
Title
Characterizing alpine basin land cover classes and their influence on water storage and routing in the Mackenzie Mountains, Kaska & Shúhtaot'ine shared territory
Year
2020
100 / 292
Publication 1.0
T-2024-10-30-V2V1QooJGnoUGfV1WN1F3aV2nQ
Abstract
Vegetation growth and productivity in Canada's boreal are governed by a characteristically short growing season, which is largely driven by the Freeze/Thaw(F/T) cycles that constrain the supply of water and nutrients through seasonally frozen soils. Since much of the vegetation in the Canadian boreal consists of evergreen species which do not experience large seasonal cycles in photosynthetic biomass, monitoring this growing season through the use of visible and near-infrared wavelengths via spectral indices such as the Normalized Difference Vegetation Index (NDVI) has proven difficult. To adequately capture growing season constraints in these northern environments, microwave remote sensing offers potential. L-band passive microwave observations are sensitive to near-surface soil moisture conditions and can monitor F/T states effectively due to the high contrast in permittivity between frozen and thawed soils. We characterize F/T information using products from both the Soil Moisture O ...
Authorship
Melser Ramon, Coops Nicholas C., Derksen Chris
Citation
Melser Ramon, Coops Nicholas C., Derksen Chris (2024) Characterizing satellite-derived freeze/thaw regimes through spatial and temporal clustering for the identification of growing season constraints on vegetation productivity, Remote Sensing of Environment, Volume 309, 2024, 114210, ISSN 0034-4257
PublicationType
Journal Article
Year
2024
101 / 292
Publication 1.0
T-2025-08-19-N1dr12vMVEkyYsBe4y7Ig5w
Abstract
Plant diversity varies immensely over large-scale gradients in temperature, precipitation, and seasonality at global and regional scales. This relationship may be driven in part by climatic variation in the relative importance of abiotic and biotic interactions to the diversity and composition of plant communities. In particular, biotic interactions may become stronger and more host specific with increasing precipitation and temperature, resulting in greater plant species richness in wetter and warmer environments. This hypothesis predicts that the many defensive compounds found in plants’ metabolomes should increase in richness and decrease in interspecific similarity with precipitation, temperature, and plant diversity. To test this prediction, we compared patterns of chemical and morphological trait diversity of 140 woody plant species among seven temperate forests in North America representing 16.2°C variation in mean annual temperature (MAT), 2,115 mm variation in mean annual prec ...
Authorship
Sedio, B. E., Spasojevic, M. J., Myers, J. A., Wright, S. J., Person, M. D., Chandrasekaran, H., Dwenger, J. H., Prechi, M. L., López, C. A., Allen, D. N., Anderson-Teixeira, K. J., Baltzer, J. L., Bourg, N. A., Castillo, B. T., Dewald-Wang, E., Dick, C. W., James, T. Y., Kueneman, J. G., LaManna, J., Lutz, J. A., McGregor, I. R., McMahon, S. M., Parker, J. D., and Vandermeer, J. H.
Project
GWF-NWF: Northern Water Futures|
PublicationType
Journal Article
Year
2021
102 / 292
Publication 1.0
T-2024-10-24-u1MlE0u3JcvUeku2aC6qPBZog
Authorship
Qu, Y., Scott, K.A.
Citation
Qu, Y., Scott, K.A. (2024) Classification of Ice and Water In a Regulated River Using Convolutional Neural Networks, Geoinformatics 2024
Project
GWF-Remotely Sensed Monitoring of Northern Lake Ice Using RADARSAT Constellation Mission and Cloud Computing|
PublicationType
Conference Presentation
Title
Classification of Ice and Water In a Regulated River Using Convolutional Neural Networks
Year
2024
103 / 292
Publication 1.0
T-2022-12-03-T1HqD9XQOx0CT22D5sgdGpxw
Authorship
Tang, W., and Carey, S.K.
Citation
Tang, W., and Carey, S.K. 2022.?Classifying Annual Daily Hydrographs in Western North America using t-Distributed Stochastic Neighbor Embedding (t-SNE). Hydrological Processes. https://doi.org/10.1002/hyp.14473.
Project
GWF-MWF: Mountain Water Futures|
PublicationType
Journal Article
Title
Classifying Annual Daily Hydrographs in Western North America using t-Distributed Stochastic Neighbor Embedding (t-SNE
Year
2022
104 / 292
Publication 1.0
T-2023-01-20-L1ll8eAHGGU2GvZucfdGzBA
Authorship
Pietroniro, A., T.D. Prowse, and V. Lalonde
Citation
Pietroniro, A., T.D. Prowse, and V. Lalonde, (1996). Classifying terrain in a muskeg-wetland regime for application to a GRU type distributed hydrologic model. Canadian Journal of Remote Sensing, 22(1), 45-52.
PublicationType
Journal Article
Title
Classifying terrain in a muskeg-wetland regime for application to a GRU type distributed hydrologic model
Year
1996
105 / 292
Publication 1.0
T-2022-12-05-81br0tGhLJUyMNk83PmGx781Q
Abstract
A code clone is a pair of similar code fragments, within or between software systems. To detect each possible clone pair from a software system while handling the complex code structures, the clone detection tools undergo a lot of generalization of the original source codes. The generalization often results in returning code fragments that are only coincidentally similar and not considered clones by users, and hence requires manual validation of the reported possible clones by users which is often both time-consuming and challenging. In this paper, we propose a machine learning based tool 'CloneCognition' (Open Source Codes: https://github.com/pseudoPixels/CloneCognition ; Video Demonstration: https://www.youtube.com/watch?v=KYQjmdr8rsw) to automate the laborious manual validation process. The tool runs on top of any code clone detection tools to facilitate the clone validation process. The tool shows promising clone classification performance with an accuracy of up to 87.4%. The tool ...
Authorship
Mostaeen, G., Svajlenko, J., Roy, B., Roy, C. K., & Schneider, K. A.
Citation
Mostaeen, G., Svajlenko, J., Roy, B., Roy, C. K., & Schneider, K. A. (2019). CloneCognition: machine learning based code clone validation tool. In Proceedings of the 2019 27th ACM Joint Meeting on European Software Engineering Conference and Symposium on the Foundations of Software Engineering (pp. 1105-1109). https://doi.org/10.1145/3338906.3341182
PublicationType
Journal Article
Year
2019
106 / 292
Publication 1.0
T-2025-11-29-f1kDwgzT8f30G5B52lTcudhA
Abstract
Per- and poly-fluoroalkyl substances (PFASs) are a diverse group of over 12,000 synthetic, amphiphilic compounds known for a resistance to degradation that has led to some compounds having a widespread, global presence. Despite not being considered acutely potent compared to other environmental pollutants, PFASs can undergo extensive biomagnification and bioaccumulation in aquatic environments. This results in both humans and wildlife being chronically exposed to PFASs and resulting in some PFASs also being ubiquitous in blood and tissues, with associated toxic effects. While specific substances of concern have been phased-out or banned, other PFASs that are emerging as alternative substances are still produced and are being released into the environment. These “replacement” PFASs are emerging as potential contaminants of concern but remain under-studied and un-tested with relatively unknown toxicity profiles. Therefore, this dissertation aimed to (1) provide an assessment of two such ...
Authorship
Mahoney, H.
Project
GWF-NGS: Next Generation Solutions for Healthy Water Resources|
PublicationType
Thesis
Year
2024
107 / 292
Publication 1.0
T-2023-01-20-O1vTO1vCHteUWDsB2lmgM9XQ
Authorship
Bellisario, L., L.D. Boudreau, D.L. Verseghy, W.R. Rouse, and P.D. Blanken
Citation
Bellisario, L., L.D. Boudreau, D.L. Verseghy, W.R. Rouse, and P.D. Blanken, (1999). Comparing the performance of the Canadian Land Surface Scheme (CLASS) for two subarctic terrain types. Atmos-Ocean, 38, 181-204.
PublicationType
Journal Article
Title
Comparing the performance of the Canadian Land Surface Scheme (CLASS) for two subarctic terrain types
Year
1999
108 / 292
Publication 1.0
T-2023-01-21-51bAZSx3H6kyFsg7iD9fWsg
Authorship
Kamali M., K. Ponnambalam and E.D. Soulis.
Citation
Kamali M., K. Ponnambalam and E.D. Soulis. (2007). Computationally efficient calibration of WATCLASS Hydrologic models using surrogate optimization. Hydrology and Earth System Sciences - Discussions pp2307-2321
PublicationType
Journal Article
Title
Computationally efficient calibration of WATCLASS Hydrologic models using surrogate optimization
Year
2007
109 / 292
Publication 1.0
T-2024-02-27-e1GoYfZVq5EmAe3FtErmgsqw
Authorship
Shantz, S., Strickert, G.
Citation
Shantz, S., Strickert, G. (2023) Confluences of Water, Art and Science. Invited Talk to Class at Western University Feb 14th, 1:30 - 3:00 PM
Project
GWF-IMPC: Integrated Modelling Program for Canada|
PublicationOutlet
Invited Talk to Class at Western University Feb 14th, 1:30 - 3:00 PM
PublicationType
Conference Presentation
Year
2023
110 / 292
Publication 1.0
T-2023-01-04-41N0hojEwNE6B41Ewf5LQ343A
Authorship
Mutton, D., Arain, M. A.
Citation
Mutton, D., Arain, M. A. Coupled MESH-CLASSIC model for catchment-scale water and carbon cycle studies. Global Water Futures 4th Annual Science Meeting. University of Saskatoon, Saskatoon, Saskatchewan, Canada , May 17-19, 2021.
Project
GWF-SFWF: Southern Forests Water Futures|
PublicationType
Conference Presentation
Title
Coupled MESH-CLASSIC model for catchment-scale water and carbon cycle studies
Year
2021
111 / 292
Publication 1.0
T-2023-01-04-N1gTUkLC9nkqSvIqTaYEN1Lg
Abstract
The North American beaver (Castor canadensis) is regarded widely as an ecosystem engineer and the dams they create are well known for their ability to drastically alter the hydrology of river basins. As a result, beavers are increasingly being included in green infrastructure practices to combat the effects of climate change and enhance ecosystem resilience. Both drought and flood mitigation capabilities have been observed in watersheds with beaver dam structures; however, how dams can possess such contrasting mitigation abilities is not fully understood as most studies neglect to acknowledge the incredible variation in beaver dam structures. In this study, an extensive cross-site survey of dam properties and water flow through dams in the Canadian Rocky Mountains in Alberta was conducted. The dam flow type classification from Woo and Waddington (1990) was evaluated in this new context and adapted to include two new flow types not found in the original study. The survey revealed signif ...
Authorship
Ronnquist, Amanda.
Citation
Ronnquist, Amanda. 2021. Dam different! How the physical properties of beaver dams influence water storage dynamics. MSc. Thesis, University of Saskatchewan. https://harvest.UofS.ca/handle/10388/13230.
Project
GWF-MWF: Mountain Water Futures|
PublicationType
Thesis
Year
2021
112 / 292
Publication 1.0
T-2025-06-27-p1cECyMHyE0GTIThJ7Qp3IQg
Abstract
Optimizing microbial metabolism and improving wastewater treatment efficiency require a deep understanding of carbon utilization and advanced microbial monitoring tools. While mixotrophic bacteria offer promising applications in bioplastic production, challenges persist in understanding their metabolic preferences under varying substrate conditions. Similarly, the ability to accurately detect bacteria is essential for preventing sludge bulking and ensuring operational efficiency. This dissertation addresses these challenges by investigating the carbon preferences of a mixotrophic bacterium for enhanced biopolymer synthesis and developing artificial intelligence (AI)-based image processing tools for microbial detection and segmentation in wastewater treatment. Specifically, the metabolic mechanisms and bacteria substrate preferences were explored under different organic (acetate, butyrate) and gaseous (H₂, CO₂, O₂) concentrations, revealing a predominant reliance on organic carbon durin ...
Authorship
Al-Ani, Sama
PublicationType
Thesis
Year
2025
113 / 292
Publication 1.0
T-2025-03-27-J1mNAvDZiBEJ2RquCJ1DB4anA
Abstract
In municipal wastewater treatment, effective secondary clarification relies on the balance between floc-forming bacteria and filamentous bacteria. Consequently, comprehensive and real-time monitoring of this balance will enable reliable operation of biological wastewater treatment. This research presents an artificial intelligence (AI)-based approach for the classification of filamentous and floc-forming bacteria in microscopic images using deep learning. To provide ground truth labeling, an automated rule-based segmentation algorithm was developed using color and morphology criteria along with supplementary filtration steps to enhance the precision of filamentous and floc-forming bacteria identification. The segmentation algorithm demonstrated reliable detection and categorization of bacteria across varying background intensities and effectively recognized intricate microbial configurations. Subsequently, the supervised deep learning model was trained on the segmented images and const ...
Authorship
Al-Ani, Sama; Guo, Hui; Fyfe, Sheila; Long, Zebo; Donnaz, Sylvain; Kim, Younggy
Citation
Al-Ani, Sama; Guo, Hui; Fyfe, Sheila; Long, Zebo; Donnaz, Sylvain; Kim, Younggy (2024) Deep learning-based image analysis for filamentous and floc-forming bacteria in wastewater treatment, Journal of Water Process Engineering, Vol. 65, 105772, https://doi.org/10.1016/j.jwpe.2024.105772
Project
GWF-Artificial Intelligence for Rapid and Reliable Detection of Cryptosporidium oocysts and Giardia cysts|
PublicationType
Journal Article
Year
2024
114 / 292
Publication 1.0
T-2024-01-29-61ks1UXnE4Ue0vS2u8C9lZA
Abstract
Various functional DNA molecules have been used for the detection of environmental contaminants in water, but their practical applications have been limited. To address this gap, this review highlights the efforts to develop field-deployable water quality biosensors. The biosensor devices include microfluidic, lateral flow and paper-based devices, and other novel ideas such as the conversion of glucometers for the detection of environmental analytes. In addition, we also review DNA-functionalized hydrogels and their use in diffusive gradients in thin films (DGT) devices. We classify the sensors into one-step and two-step assays and discuss their practical implications. While the review is focused on works reported in the last five years, some classic early works are cited as well. Overall, most of the existing work only tested spiked water samples. Future work needs to shift to real environmental samples and the comparison of DNA-based sensors to standard analytical methods.
Authorship
Zhao, Y., Yavari, K., Wang, Y., Pi, K., Van Cappellen, P., Liu, J.
Citation
Zhao, Y., Yavari, K., Wang, Y., Pi, K., Van Cappellen, P., Liu, J. (2022) Deployment of Functional DNA-Based Biosensors for Environmental Water Analysis. TrAC, Trends Anal. Chem. 2022, 153, 116639
https://doi.org/10.1016/j.trac.2022.116639
Project
GWF-WSPT: Winter Soil Processes in Transition|GWF-SSSWQM: Sensors and Sensing Systems for Water Quality Monitoring|
PublicationType
Journal Article
Year
2022
115 / 292
Publication 1.0
T-2024-01-30-M11GkNB2HFU2M2PchGRHQonw
Abstract
The Köppen-Geiger (KG) climate classification has been widely used to determine the climate at global and regional scales using precipitation and temperature data. KG maps are typically developed using a single product; however, uncertainties in KG climate types resulting from different precipitation and temperature datasets have not been explored in detail. Here, we assess seven global datasets to show uncertainties in KG classification from 1980 to 2017. Using a pairwise comparison at global and zonal scales, we quantify the similarity among the seven KG maps. Gauge- and reanalysis-based KG maps have a notable difference. Spatially, the highest and lowest similarity is observed for the North and South Temperate zones, respectively. Notably, 17% of grids among the seven maps show variations even in the major KG climate types, while 35% of grids are described by more than one KG climate subtype. Strong uncertainty is observed in south Asia, central and south Africa, western America, an ...
Authorship
Hobbi, S., Michael Papalexiou, S., Rupa Rajulapati, C., Nerantzaki, S. D., Markonis, Y., Tang, G., Clark, M. P.
Citation
Hobbi, S., Michael Papalexiou, S., Rupa Rajulapati, C., Nerantzaki, S. D., Markonis, Y., Tang, G., Clark, M. P. (2022) Detailed investigation of discrepancies in Köppen-Geiger climate classification using seven global gridded products. Journal of Hydrology, 612, 128121. https://doi.org/10.1016/j.jhydrol.2022.128121
Project
GWF-Paradigm Shift in Downscaling Climate Model Projections|
PublicationType
Journal Article
Title
Detailed investigation of discrepancies in Köppen-Geiger climate classification using seven global gridded products
Year
2022
116 / 292
Publication 1.0
T-2022-12-05-b1KrVNyb3P1E2Yxb1T6I2vdOQ
Abstract
If two or more program entities (such as files, classes, methods) co-change (i.e., change together) frequently during software evolution, then it is likely that these two entities are coupled (i.e., the entities are related). Such a coupling is termed as evolutionary coupling in the literature. The concept of traditional evolutionary coupling restricts us to assume coupling among only those entities that changed together in the past. The entities that did not co-change in the past might also have coupling. However, such couplings can not be retrieved using the current concept of detecting evolutionary coupling in the literature. In this paper, we investigate whether we can detect such couplings by applying transitive rules on the evolutionary couplings detected using the traditional mechanism. We call these couplings that we detect using our proposed mechanism as transitive evolutionary couplings. According to our research on thousands of revisions of four subject systems, transitive e ...
Authorship
Islam, M. A., Islam, M. M., Mondal, M., Roy, B., Roy, C. K., & Schneider, K. A.
Citation
Islam, M. A., Islam, M. M., Mondal, M., Roy, B., Roy, C. K., & Schneider, K. A. (2018). Detecting evolutionary coupling using transitive association rules. In 2018 IEEE 18th International Working Conference on Source Code Analysis and Manipulation (SCAM) (pp. 113-122). IEEE. https://doi.org/10.1109/SCAM.2018.00020
PublicationType
Journal Article
Year
2018
117 / 292
Publication 1.0
T-2021-11-12-s1IB6T9qTQ0yKZH7DdLK9HA
Abstract
Snow interception in cold regions needleleaf forest canopies is a crucial process that controls local snow accumulation and redistribution over >20% of the Earth's land surface. Various ground-based methods exist to measure intercepted snow load, however all are based on single-tree measurements and are difficult to implement. No research has focussed on detecting large areal intercepted snow loads and no studies have assessed the use of satellite observations. In this study, four remote sensing indices (NDSI, NDVI, albedo, and land surface temperature (LST)) were retrieved from Landsat images to study their sensitivity to canopy intercepted snow and the possibility of using them to detect the presence of intercepted snow. The results indicate that presence of intercepted snow on canopy increased NDSI and albedo, but decreased NDVI. Intercepted snow presence also decreased the areal variability of NDSI and NDVI while increasing that of albedo. For these three indices, the differences b ...
Authorship
Lv, Z., & Pomeroy, J. W.
Citation
Lv, Z., & Pomeroy, J. W. (2019). Detecting intercepted snow on mountain needleleaf forest canopies using satellite remote sensing. Remote Sensing of Environment, 231, 111222.
Project
INARCH1: International Network of Alpine Research Catchment Hydrology (Phase 1)|
PublicationType
Journal Article
Year
2019
118 / 292
Publication 1.0
T-2021-11-14-013oFa6Fr01EuRIGhe401Xbcw
Abstract
Vernal pools are small, temporary, forested wetlands of ecological importance with a high sensitivity to changing climate and land-use patterns. These ecosystems are under considerable development pressure in southeastern Georgian Bay, where mapping techniques are required to inform wise land-use decisions. Our mapping approach combines common machine learning techniques [random forest, support vector machines (SVMs)] with object-based image analysis. Using multispectral image segmentation on high-resolution orthoimagery, we first created objects and assigned classes based on field collected data. We then supplied machine learning algorithms with data from freely available sources (Ontario orthoimagery and Sentinel 2) and tested accuracy on a reserved dataset. We achieved producer’s accuracies of 85 and 79% and user’s accuracies of 78 and 84% for random forest and SVMs models, respectively. Difficulty differentiating between small, dark shadows and small, obscured pools accounted for m ...
Authorship
Luymes, N., & Chow-Fraser, P.
Citation
Luymes, N., & Chow-Fraser, P. (2021). Detection of potential vernal pools on the Canadian Shield (Ontario) using object-based image analysis in combination with machine learning. Can. J. Remote Sensing. In press. https://doi.org/10.1080/07038992.2021.1900717
Project
GWF-BWF: Boreal Water Futures|
PublicationType
Journal Article
Year
2021
119 / 292
Publication 1.0
T-2022-04-24-J1MCwdjiKj0J2Ov6dVlKKA7g
Abstract
There are many real-world hydrological problems on the Canadian Prairies for which existing tools are poorly suited, due to the region’s complex cold-region hydrology and its equally complex hydrography, which is dominated by depressions, poorly defined and results in dynamic drainage basin contributing areas to streamflow. The complexities of the problems are compounded by changes in hydrology due to climate change, and by changes in depressional storage capacities due to wetland drainage. Although some hydrological models (CRHM, MESH) are able to simulate Prairie hydrology, including the effects of changes in climate, they do not have the ability to simulate detailed local-scale hydraulics. Conversely, hydraulic models which can simulate these small-scale features do not have the ability to simulate prairie hydrological processes.
The Prairie Hydrology Design and Analysis Product (PHyDAP) deploys the research results of the GWF Prairie Water Project to produce a tool useful for solvi ...
Authorship
Shook Kevin, He Zhihua, Spence Christopher, Whitfield Colin, Pomeroy John, Morrison Alasdair
Citation
Kevin Shook, Zhihua He, Christopher Spence,Colin Whitfield, John Pomeroy,Alasdair Morrison (2022). Development of the Prairie Hydrology Design and Analysis Product (PHyDAP). Proceedings of the GWF Annual Open Science Meeting, May 16-18, 2022.
Project
GWF-PW: Prairie Water|
PublicationType
Conference Presentation
Year
2022
120 / 292
Publication 1.0
T-2023-11-06-T1qCzUPFYtkyyqBGbymss7Q
Abstract
Preferential flowpaths transport phosphorus (P) to agricultural tile drains. However, if and to what extent this may vary with soil texture, moisture conditions, and P placement is poorly understood. This study investigated (a) interactions between soil texture, antecedent moisture conditions, and the relative contributions of matrix and preferential flow and (b) associated P distributions through the soil profile when fertilizers were applied to the surface or subsurface. Brilliant blue dye was used to stain subsurface flowpaths in clay and silt loam plots during simulated rainfall events under wet and dry conditions. Fertilizer P was applied to the surface or via subsurface placement to plots of different soil texture and moisture condition. Photographs of dye stains were analysed to classify the flow patterns as matrix dominated or macropore dominated, and soils within plots were analysed for their water-extractable P (WEP) content. Preferential flow occurred under all soil texture ...
Authorship
Grant, K. N., Macrae, M. L., Ali, G.
Citation
Grant, K. N., Macrae, M. L., Ali, G. (2019). Differences in preferential flow with antecedent moisture conditions and soil texture: Implications for subsurface P transport. In Hydrological Processes, Volume 33, Issue 15. Wiley. (2068-2079). https://doi.org/10.1002/hyp.13454
Project
GWF-AWF: Agricultural Water Futures|
PublicationType
Journal Article
Year
2019
121 / 292
Publication 1.0
T-2021-11-14-91Kw92QfZKHUGqBgzeMKZA92g
Abstract
In addition to aiding in digestion of food and uptake of nutrients, microbiota in guts of vertebrates are responsible for regulating several beneficial functions, including development of an organism and maintaining homeostasis. However, little is known about effects of exposures to chemicals on structure and function of gut microbiota of fishes. To assess effects of exposure to polycyclic aromatic hydrocarbons (PAHs) on gut microbiota, male and female fathead minnows (Pimephales promelas) were exposed to environmentally-relevant concentrations of the legacy PAH benzo[a]pyrene (BaP) in water. Measured concentrations of BaP ranged from 2.3 × 10⁻³ to 1.3 μg L−1. The community of microbiota in the gut were assessed by use of 16S rRNA metagenetics. Exposure to environmentally-relevant aqueous concentrations of BaP did not alter expression levels of mRNA for cyp1a1, a “classic” biomarker of exposure to BaP, but resulted in shifts in relative compositions of gut microbiota in females rather ...
Authorship
DeBofsky, A., Xie, Y., Grimard, C., Alcaraz, A. J., Brinkmann, M., Hecker, M., & Giesy, J. P.
Citation
DeBofsky, A., Xie, Y., Grimard, C., Alcaraz, A. J., Brinkmann, M., Hecker, M., & Giesy, J. P. (2020). Differential responses of gut microbiota of male and female fathead minnow (Pimephales promelas) to a short-term environmentally-relevant, aqueous exposure to benzo [a] pyrene. Chemosphere, 252, 126461. https://doi.org/10.1016/j.chemosphere.2020.126461
Project
GWF-NGS: Next Generation Solutions for Healthy Water Resources|
PublicationType
Journal Article
Year
2020
122 / 292
Publication 1.0
T-2023-01-04-71Dn1jBey71kO73ILWcY0pqvQ
Authorship
Hobbi, S., Papalexiou, S.M., Rupa, C., Tang, G., Clark, M.P., Markonis, I.
Citation
Hobbi, S., Papalexiou, S.M., Rupa, C., Tang, G., Clark, M.P., Markonis, I., 2021. Discrepancies in Köppen-Geiger Climate Classification Using Ten Global Gridded Products. AGU Fall Meeting 2021, AGU.?
PublicationType
Conference Presentation
Title
Discrepancies in Köppen-Geiger Climate Classification Using Ten Global Gridded Products
Year
2021
123 / 292
Publication 1.0
T-2023-01-04-Y1wOKD4IMtk6Zt2BbLUaqeQ
Authorship
Holmes Jason
Citation
Holmes Jason , Discrete-time Markov chain modelling of the Ontario air quality health index & image classification of Diatom genera using decision tree-based classifiers, 2021
Project
GWF-Artificial Intelligence for Rapid and Reliable Detection of Cryptosporidium oocysts and Giardia cysts|
PublicationType
Thesis
Title
Discrete-time Markov chain modelling of the Ontario air quality health index & image classification of Diatom genera using decision tree-based classifiers
Year
2021
124 / 292
Publication 1.0
T-2024-08-14-01EkxK3zcbkKHrxfZlHy6Zw
Abstract
Differential impacts of policies or changes in environmental conditions on people is a growing area of interest to decision-makers, yet remains an often neglected area of study for the environmental valuation literature. Using data from a large national survey of over 24,000 people conducted in Canada, this paper implements a latent class Kuhn-Tucker recreation demand model to assess differences in preferences and values for nature-based activities. Preferences are disaggregated by self-reported Indigeneity, immigration status, and gender. We find that Indigenous people receive 63% greater benefits from participating in nature-based activities compared to non-Indigenous people living in Canada. Immigrants have the lowest participation in, and benefits associated with, nature-based activities. Similarly, women receive 21% lesser benefits associated with nature-based activities when compared to men. These results demonstrate that Indigenous peoples may be more vulnerable to adverse impac ...
Authorship
Spence, D.S., Schuster-Wallace, C-J., Lloyd-Smith, P.
Citation
Spence, D.S., Schuster-Wallace, C-J., Lloyd-Smith, P. (2023) Disparities in economic values for nature-based activities in Canada. Ecological Economics, Volume 205, March 2023, 107724. https://doi.org/10.1016/j.ecolecon.2022.107724
Project
GWF-Hydrology - Ecology Feedbacks in the Arctic: Narrowing the Gap Between Theory and Models|
PublicationType
Journal Article
Year
2023
125 / 292
Publication 1.0
T-2023-01-14-E1PjE12E2nG4kSfn9wuM5U3hA
Authorship
Kershaw, G.G.L.
Citation
Kershaw, G.G.L. (2019). Distinguishing alpine valley landcover classes based on surface and subsurface hydrology. Cold Regions Research Centre Days. Waterloo, ON, Canada. (Oral) Conference Presentation
PublicationType
Conference Presentation
Title
Distinguishing alpine valley landcover classes based on surface and subsurface hydrology
Year
2019
126 / 292
Publication 1.0
T-2022-12-03-J11fgVbCS60uvgI88yBnKeg
Abstract
Phytoplankton monitoring is essential for better understanding and mitigation of phytoplankton bloom formation. We present a microfluidic cytometer with two imaging modalities for onsite detection and identification of phytoplankton: a lensless imaging mode for morphological features, and a fluorescence imaging mode for autofluorescence signal of phytoplankton. Both imaging modes are integrated in a microfluidic device with a field of view (FoV) of 3.7 mm × 2.4 mm and a depth of field (DoF) of 0.8 mm. The particles in the water flow channel can be detected and classified with automated image processing algorithms and machine learning models using their morphology and fluorescence features. The performance of the device was demonstrated by measuring Chlamydomonas, Euglena, and non-fluorescent beads in both separate and mixed flow samples. The recall rates for Chlamydomonas and Euglena ware 93.6% and 94.4%. The dual-modality imaging approach enabled observing both morphology and fluoresc ...
Authorship
Bo Xiong, Tian-Qi Hong, Herb Schellhorn, Qiyin Fang
Citation
Bo Xiong, Tian-Qi Hong, Herb Schellhorn, Qiyin Fang, Dual-Modality Imaging Microfluidic Cytometer for Onsite Detection of Phytoplankton, Photonics 8, 435, 2021.
Project
GWF-Artificial Intelligence for Rapid and Reliable Detection of Cryptosporidium oocysts and Giardia cysts|
PublicationType
Journal Article
Year
2021
127 / 292
Publication 1.0
T-2025-04-24-I1VPUKaAYVUC8pKaWfxO58g
Authorship
Al-Ani, S., Guo, H., Fyfe, S., Long, Z., Donnaz, S., Younggy, K.
Project
GWF-Artificial Intelligence for Rapid and Reliable Detection of Cryptosporidium oocysts and Giardia cysts|
PublicationType
Journal Article
Title
Effect of training sample size, image resolution and epochs on filamentous and floc-forming bacteria classification using machine learning
Year
2025
128 / 292
Publication 1.0
T-2024-10-30-l1nl34Ml2voGk2Bwc6IeWCwjg
Abstract
Tile-drainage area has expanded across the Canadian Lake Erie watershed in recent decades, and effects on phosphorus (P) loading are unclear. Eleven years (2010 to 2021) of daily P, total suspended solids (TSS), discharge, and climatological data were aggregated from three Canadian tributaries that form a gradient of tiled areas: East Sydenham River (ESR, 60% tile), Thames River (TR, 48% tile), and Grand River (GR, 23% tile). Instead of using traditional seasons (winter, spring, summer, fall), we classified seasons by air temperature to highlight hydrological periods of importance for P loss through tile drains. Seasons included frozen (<?3.2 °C), thawing (?3.2 – 6.7 °C), bare (6.7 – 15.9 °C), and growing (>15.9 °C). Nonparametric comparisons revealed that during every season, the ESR and TR had significantly higher soluble reactive P (SRP) and total P (TP) concentrations than the GR. For %SRP, the ESR was significantly higher than the other rivers during every season, while for TSS, t ...
Authorship
Tedeschi Alana C., Fortier Rachelle A., Chow-Fraser Patricia
Citation
Tedeschi Alana C., Fortier Rachelle A., Chow-Fraser Patricia (2024) Effects of increasing tile drainage and seasonal weather patterns on phosphorus loading from three major Canadian Lake Erie tributaries, Journal of Great Lakes Research, Volume 50, Issue 5, 2024, 102396, ISSN 0380-1330
PublicationType
Journal Article
Year
2024
129 / 292
Publication 1.0
T-2024-12-19-11cq35Lgev0eBU11E64gqknA
Abstract
Large-scale pre-trained transformer models such as BERT have become ubiquitous in Natural Language Processing (NLP) research and applications. They bring significant improvements to both academia benchmarking tasks and industry applications: the average score on the General Language Understanding Evaluation benchmark (GLUE) has increased from 74 to 90+; commercial search engines such as Google and Microsoft Bing are also applying BERT-like models to search. Despite their exciting power, these increasingly large transformer-based models are notorious for having billions of parameters and being slow in both training and inference, making deployment difficult when inference time and resources are limited. Therefore, model efficiency has become a more important and urgent problem in the transformer era. In this thesis, we propose and innovate methods for efficient NLP models. We choose to specifically focus on inference efficiency: pre-trained models are almost always publicly available, a ...
Authorship
Xin, Ji
Citation
Xin, Ji (2023) Efficient Inference of Transformers in Natural Language Processing: Early Exiting and Beyond, UWSpace - Theses, http://hdl.handle.net/10012/19111
Project
GWF-CS: Computer Science|
PublicationType
Thesis
Year
2023
130 / 292
Publication 1.0
T-2024-12-19-T1g1qmrM8m0ifJ22HT1d2slA
Abstract
Climate change, water stress, and rapid population growth have increased the need to manage water resources through innovative sustainable technologies. Decentralized systems such as membrane treatment trains have become increasingly important to provide high volumes of potable water to millions of people. Pressure-driven membrane systems have dominated separation processes due to their low cost, small footprint, ease of operation, and high permeate quality. Conventionally, pressure-driven membranes are classified into microfiltration (MF), ultrafiltration (UF), nanofiltration (NF), and reverse osmosis (RO). MF and UF membranes operate under low pressure (< 7 bar, <~100 psi). They can separate a variety of large particles such as bacteria, natural organic matter, suspended solids, and colloids. In contrast, NF and RO membranes are more energy-intense due to operating at high pressures (7 – 80 bar, ~100 – 1200 psi) and can remove small molecules such as ions, pharmaceuticals, and heavy ...
Authorship
Halali, Mohamad Amin
Citation
Halali, Mohamad Amin (2021) Electrically Conductive Membranes for Water and Wastewater Treatment: Their Surface Properties, Antifouling Mechanisms, and Applications, MacSphere Open Access Dissertations and Theses, http://hdl.handle.net/11375/26707
PublicationType
Thesis
Year
2021
131 / 292
Publication 1.0
T-2025-08-06-f1GaajlBt80aT2SQNf1Y1n0g
Abstract
Wet terrestrial ecosystems play a vital role in the Arctic, linking various hydro-ecological and permafrost processes. However, climate warming is altering these ecosystems, impacting their functional properties and spatial extents. Despite their importance, current maps are often limited by thematic detail, spatial resolution, or coverage. To better assess ecosystem status, vulnerability, and changes, more comprehensive datasets are needed. This Ph.D. addressed this research gap by studying several emerging Earth observation (EO), remote sensing (RS), and machine learning (ML) techniques for enhanced wet terrestrial ecosystem mapping and monitoring across the Arctic at various spatial scales, from local to regional. Each chapter examined new spaceborne synthetic aperture radar (SAR) datasets, given SAR's sensitivity to moisture and inundation. The initial chapters focused on high and very-high resolution (VHR) SAR imagery. First, the recently launched Radarsat Constellation Mission (R ...
Authorship
Merchant, M.
Project
GWF-NWF: Northern Water Futures|
PublicationType
Thesis
Year
2025
132 / 292
Publication 1.0
T-2022-12-03-r1Obpw15yaUyJtxhj4ENoNw
Abstract
Aim
High-throughput pipelines supported by eDNA metabarcoding have been applied in various freshwater ecosystems. Both eDNA in ethanol (EtOH) samples (ES-eDNA) and in water samples (WS-eDNA) can provide comprehensive classification lists with good taxonomic resolution and coverage for determining freshwater biodiversity and biomonitoring. But, the advantages of ES-eDNA metabarcoding over WS-eDNA metabarcoding remain unclear for routine assessments of diversity of benthic macroinvertebrates in streams.
Location
Qiantang River Basin, China.
Methods
Here, we compared ES-eDNA and WS-eDNA metabarcoding to evaluate the performance of two eDNA workflows in determining biodiversity and recovery of damaged macroinvertebrate communities. All eDNA samples from the environment and bulk specimen of macroinvertebrates were processed into available molecular operational taxonomic units (MOTUs) and identified to the level of genus.
Results
WS-eDNA detected more exact sequence variants (ESVs) (for ...
Authorship
Wang, Y., K. Chen, J. Gao, M. Wang, J. Dong, F. Zhang, Y.-Y. Xie, J.P. Giesy, X.-W. Jin and B.-X. Wang.
Citation
Wang, Y., K. Chen, J. Gao, M. Wang, J. Dong, F. Zhang, Y.-Y. Xie, J.P. Giesy, X.-W. Jin and B.-X. Wang. 2021. Environmental DNA of Preservative Ethanol Performed Better over Water Environmental DNA of preservative EtOH performed better than samples of water in detecting macroinvertebrate diversity using metabarcoding. Diversity Distributions 2021;00:1�14. https://doi.org/10.1111/ddi.13284
Project
GWF-NGS: Next Generation Solutions for Healthy Water Resources|
PublicationType
Journal Article
Year
2021
133 / 292
Publication 1.0
T-2022-04-24-0103ia9e6tdUGK502fUPxMpig
Abstract
Accurate estimation of precipitation fields remains a grand challenge in cold regions hydrology due to the sparseness of precipitation gauges and lack of quantitative precipitation estimation from ground based weather radars. It is even more challenging in cold regions mountains due to blockage of ground based weather radars, and the complexity of modelling precipitation. Satellite remote sensing provides an alternative to precipitation monitoring in complex terrain when retrieval algorithms are able to represent a range of hydrometeor types. The Global Precipitation Measurement (GPM) satellite constellation has been successfully monitoring liquid precipitation since early 2014 through the Integrated Multi-SatellitE Retrievals for GPM (IMERG) algorithm. IMERG uses a constellation of satellites with passive microwave and infrared sensors to estimate precipitation, which is intercalibrated using GPM’s core platform Dual-frequency Precipitation Radar (DPR). The DPR sensor has been working ...
Authorship
Bertoncini, A., Thériault, J. M., Pomeroy, J.
Citation
Bertoncini, A., Thériault, J. M., Pomeroy, J. (2022). Establishing Reflectivity-Snowfall Relationships for Different Hydrometeor Particle Size Distributions in the Fortress Mountain Snow Laboratory. Proceedings of the GWF Annual Open Science Meeting, May 16-18, 2022.
Project
GWF-MWF: Mountain Water Futures|GWF-SPADE: Storms and Precipitation Across the Continental Divide Experiment|
PublicationType
Conference Poster
Year
2022
134 / 292
Publication 1.0
T-2024-12-19-9192IbocNQ8k6c2fU0fY6vaQ
Abstract
Rising human populations and ever-increasing demand for potable water result in increased municipal wastewater production. The collection, treatment, and management of municipal wastewaters include energy-intensive processes leading to the generation and emission of greenhouse, potentially toxic, and odorous gases. The main goal of this thesis was to advance knowledge of greenhouse gas (including carbon dioxide, CO2; methane, CH4; and nitrous oxide, N2O) and smelly compound (including ammonia, NH3; and hydrogen sulphide, H2S) emissions from typical municipal wastewater treatment plants (MWTPs) to accurately describe their emission rate estimates (EREs) using operating parameters. This research included laboratory and field assessments of greenhouse gas (GHG) and odour emissions in conjunction with monitored operating parameters. Laboratory-scale reactors simulating open-to-air treatment processes including primary and secondary clarifiers and anaerobic, anoxic, and aerobic reactors, we ...
Authorship
AsadiBagloee, Mohsen
Citation
AsadiBagloee, Mohsen (2022) Estimation of greenhouse gas and odour emissions from cold region municipal biological nutrient removal wastewater treatment processes, USASK Harvest - Theses and Dissertations, https://hdl.handle.net/10388/13920
PublicationType
Thesis
Year
2022
135 / 292
Publication 1.0
T-2022-12-05-L12ycuiDd7UmjwJ8uX7oF6g
Abstract
Phosphorus (P) loss in agricultural discharge has typically been associated with surface runoff; however, tile drains have been identified as a key P pathway due to preferential transport. Identifying when and where these pathways are active may establish high-risk periods and regions that are vulnerable for P loss. A synthesis of high-frequency, runoff data from eight cropped fields across the Great Lakes region of North America over a 3-yr period showed that both surface and tile flow occurred year-round, although tile flow occurred more frequently. The relative timing of surface and tile flow activation was classified into four response types to infer runoff-generation processes. Response types were found to vary with season and soil texture. In most events across all sites, tile responses preceded surface flow, whereas the occurrence of surface flow prior to tile flow was uncommon. The simultaneous activation of pathways, indicating rapid connectivity through the vadose zone, was s ...
Authorship
Macrae, M. L., Ali, G. A., King, K. W., Plach, J., Pluer, W. T., Williams, M., Morison, M. Q., & Tang, W. V.
Citation
Macrae, M. L., Ali, G. A., King, K. W., Plach, J., Pluer, W. T., Williams, M., Morison, M. Q., & Tang, W. V. (2019). Evaluating Hydrologic Response in Tile-Drained Landscapes: Implications for Phosphorus Transport. Journal of environmental quality, 48(5), 1347-1355. https://doi.org/10.2134/jeq2019.02.0060
PublicationType
Journal Article
Year
2019
136 / 292
Publication 1.0
T-2023-01-11-x1rdvYjEgx2kCKyYIFkU4XQA
Authorship
Wu, Daniel
Citation
Daniel Wu (2019). Evaluating impacts of thinning in a temperate pine forest using CLASS-CTEM Model (B.Sc. thesis). McMaster University, Hamilton, Canada. Thesis
Project
GWF-SFWF: Southern Forests Water Futures|
PublicationType
Thesis
Title
Evaluating impacts of thinning in a temperate pine forest using CLASS-CTEM Model (B.Sc. thesis
Year
2019
137 / 292
Publication 1.0
T-2023-01-04-V14RLQYV2YeU2sL4hvy7IqzQ
Abstract
High-latitude ecosystems have experienced substantial warming over the past 40 years, which is expected to continue into the foreseeable future. Consequently, an increase in vegetation growth has occurred throughout the circumpolar North as documented through remote sensing and plot-level studies. A major component of this change is shrub expansion (shrubbing) in arctic and subarctic ecotones. However, these changes are highly variable depending on plant species, topographic position, hydrology, soils and other ecosystem properties. Changes in shrub and other vegetation properties are critical to document due to their first-order control on water, energy and carbon balances. This study uses a combination of multi-temporal LiDAR (Light Detection and Ranging) and field surveys to measure temporal changes in shrub vegetation cover over the Wolf Creek Research Basin (WCRB), a 180 km2 long-term watershed research facility located ~15 km south of Whitehorse, Yukon Territory. This work focuse ...
Authorship
Leipe, S.
Citation
Leipe, Sean. 2020. Evaluating shrub expansion in a subarctic mountain basin using multi-temporal LiDAR data. MSc. Thesis, McMaster University.
Project
GWF-MWF: Mountain Water Futures|
PublicationType
Thesis
Year
2020
138 / 292
Publication 1.0
T-2023-02-08-V1tH1qch9NUmtz9AD7NYBWw
Abstract
As wetlands around the world are being lost, policies are implemented to help protect further destruction and loss of valuable services that wetlands provide. In Alberta, wetland policy has been put in place with the goals of protecting the most valuable wetlands and replacing necessary loss of wetlands to maintain functional value. To help the policy meet its objectives, the Alberta Wetland Rapid Evaluation Tool-Actual (ABWRET-A) was developed and implemented in Alberta’s settled area in 2015 as a standardized way to give a value score via functional assessment to any wetland in the province, with the hopes that the most valuable wetlands will be conserved. These assessment tools are in constant need of review and improvement to make sure they are helping meet policy goals. I assess biases made in the selection for ABWRET-A calibration wetlands and determine how these biases affect ABWRET-A scoring to determine if subsequent scores provided by this tool are over or under estimating we ...
Authorship
Royall, O.
Citation
Royall, O. (2020). Evaluating the development and use of a rapid wetland assessment tool in policy implementation in Alberta, Canada http://hdl.handle.net/10012/15980
Project
GWF-MWF: Mountain Water Futures|
PublicationType
Thesis
Year
2020
139 / 292
Publication 1.0
T-2022-04-24-t1AswWMJWrUCLwIt1lEOlSkQ
Abstract
Supercells are the most violent thunderstorm, which can produce strong tornadoes, large hail, damaging winds, and flash flooding. From June to August, the Canadian Prairies (i.e., a major agricultural region of Canada) are greatly affected by various supercells, including low-precipitation (LP), high-precipitation (HP), and classic supercells. Despite the enormous socioeconomic impact of supercell thunderstorms over the Canadian Prairies, it remains poorly understood which environmental conditions are favorable for the development and maintenance of supercells. Therefore, this work aims to study the dynamical and thermodynamical characteristics of the environment during different supercells by examining severe weather parameters derived from soundings. Specifically, this study analyzed 23 LP, 15 HP, and 16 classic-type supercells that occurred over the Canadian Prairies and compared their dynamical and thermodynamical characteristics with their US Great Plains counterparts. Preliminar ...
Authorship
Kamal Mostofa, Li Yanping, Zhao Xiaohui
Citation
Mostofa Kamal, Yanping Li, Xiaohui Zhao (2022). Exploring the Dynamical and Thermodynamical Characteristics of Supercell Thunderstorms over the Canadian Prairies . Proceedings of the GWF Annual Open Science Meeting, May 16-18, 2022.
Project
GWF-CPE: Climate-Related Precipitation Extremes|
PublicationType
Conference Presentation
Year
2022
140 / 292
Publication 1.0
T-2022-12-05-j1mUMBmJj1nEqbxFkQWoSkDA
Abstract
BACOLI is a Fortran software package for solving one-dimensional parabolic partial differential equations (PDEs) with separated boundary conditions by B-spline adaptive collocation methods. A distinguishing feature of BACOLI is its ability to estimate and control error and correspondingly adapt meshes in both space and time. Many models of scientific interest, however, can be formulated as multiscale parabolic PDE systems, that is, models that couple a system of parabolic PDEs describing dynamics on a global scale with a system of ordinary differential equations describing dynamics on a local scale. This article describes the Fortran software eBACOLI, the extension of BACOLI to solve such multiscale models. The performance of the extended software is demonstrated to be statistically equivalent to the original for purely parabolic PDE systems. Results from eBACOLI are given for various multiscale models from the extended problem class considered.
Authorship
Green, K. R., & Spiteri, R. J.
Citation
Green, K. R., & Spiteri, R. J. (2019). Extended BACOLI: Solving One-Dimensional Multiscale Parabolic PDE Systems With Error Control. ACM Transactions on Mathematical Software (TOMS), 45(1), 1-19. https://doi.org/10.1145/3301320
PublicationType
Journal Article
Year
2019
141 / 292
Publication 1.0
T-2025-03-27-61eD561V1IWkOXY2Qa7ahXUQ
Abstract
Linking software features to code components is commonly performed during software development and maintenance, including to implement a feature, document code, design test cases, trace requirements, track changes, and support inspection of safety–critical software by government and other third parties. However, manually mapping features to code is error-prone and time consuming, even for developers familiar with a system. To overcome these challenges several studies proposed automated techniques to reduce human intervention when linking features to code components. Nonetheless, three challenges remain: (i) accuracy, (ii) cost, and (iii) explainability. Linking of irrelevant code snippets causes an extra burden of analyses. If the approach lacks explainability, then a tool is less useful for many crucial systems such as safety–critical software. Moreover, heavyweight techniques such as those that require generating execution traces of every scenario or require training deep-learning mo ...
Authorship
Mondal, Amit Kumar; Hossain, Mainul; Roy, Chanchal K.; Roy, Banani; Schneider, Kevin A.
Citation
Mondal, Amit Kumar; Hossain, Mainul; Roy, Chanchal K.; Roy, Banani; Schneider, Kevin A. (2025) FSECAM: A contextual thematic approach for linking feature to multi-level software architectural components, Journal of Systems and Software, Vol. 219, 112245, https://doi.org/10.1016/j.jss.2024.112245
Project
GWF-CS: Computer Science|
PublicationType
Journal Article
Year
2025
142 / 292
Publication 1.0
T-2022-12-03-m1pXJHUdSTUWlIza6p8m357Q
Abstract
Testing software is considered to be one of the most crucial phases in software development life cycle. Software bug fixing requires a significant amount of time and effort. A rich body of recent research explored ways to predict bugs in software artifacts using machine learning based techniques. For a reliable and trustworthy prediction, it is crucial to also consider the explainability aspects of such machine learning models. In this paper, we show how the feature transformation techniques can significantly improve the prediction accuracy and build confidence in building bug prediction models. We propose a novel approach for improved bug prediction that first extracts the features, then finds a weighted transformation of these features using a genetic algorithm that best separates bugs from non-bugs when plotted in a low-dimensional space, and finally, trains the machine learning model using the transformed dataset. In our experiment with real-life bug datasets, the random forest and ...
Authorship
Cynthia, S. T., Roy, B., and Mondal, D.
Citation
Cynthia, S. T., Roy, B., and Mondal, D. (2022) Feature Transformation for Improved Software Bug Detection Models. ACM 15th Innovation in Software Engineering Conference (ISEC 2022), Article 16, pp. 1-10. https://doi.org/10.1145/3511430.3511444
Project
GWF-CS: Computer Science|
PublicationType
Journal Article
Year
2022
143 / 292
Publication 1.0
T-2024-10-30-d1vBmL93DxkKnKxjRHCjNBg
Abstract
Testing and debugging software to fix bugs is considered one of the most important stages of the software life cycle. Many studies have investigated ways to predict bugs in software artifacts using machine learning techniques. It is important to consider the explanatory aspects of such models for reliable prediction. In this paper, we show how feature transformation can significantly improve prediction accuracy and provide insight into the inner workings of bug prediction models. We propose a new approach for bug prediction that first extracts the features, then finds a weighted transformation of these features using a genetic algorithm that best separates bugs from non-bugs when plotted in a low-dimensional space, and finally, trains predictive models using the transformed dataset. In our experiment using the proposed feature transformation, the traditional machine learning and deep learning classifiers achieved an average improvement of 4.25% and 9.6% in recall values for bug classif ...
Authorship
Sakib Mostafa, Shamse Tasnim Cynthia, Banani Roy, Debajyoti Mondal
Citation
Sakib Mostafa, Shamse Tasnim Cynthia, Banani Roy, Debajyoti Mondal (2024) Feature transformation for improved software bug detection and commit classification, Journal of Systems and Software, Volume 219, 2025, 112205, ISSN 0164-1212
PublicationType
Journal Article
Title
Feature transformation for improved software bug detection and commit classification
Year
2024
144 / 292
Publication 1.0
T-2021-11-14-B1biVxAPh00afkvI0qM46gA
Abstract
Cowichan Lake lamprey (Entosphenus macrostomus) is a threatened species resident to Mesachie Lake, Cowichan Lake, and adjoining Bear Lake and their major tributaries in British Columbia. Decreases in trapping success have created concerns that the population is declining. Some potential threats include water use, climate change, and management actions. Owing to the absence of long-term data on population trends, little information is available to estimate habitat quality and factors that influence it. We sought to fill this gap by examining associations between habitat area and variables representing suspected key drivers of habitat availability. Critical habitat areas were imaged using an unmanned aerial vehicle over a period of three years at three sites at Cowichan Lake and a subsequent habitat area was classified. Meteorological and anthropogenic controls on habitat area were investigated through automatic relevance detection regression models. The major driver of habitat area duri ...
Authorship
Chaudhuri, C., Wade, J., & Robertson, C.
Citation
Chaudhuri, C., Wade, J., & Robertson, C. (2020). Fluctuating water levels influence access to critical habitats for threatened Cowichan Lake lamprey. Facets. 5(1):488-502. https://www.facetsjournal.com/doi/full/10.1139/facets-2019-0054
Project
GWF-GWC: Global Water Citizenship (Integrating Networked Citizens, Scientists and Local Decision Makers)|
PublicationType
Journal Article
Year
2020
145 / 292
Publication 1.0
T-2022-12-05-21Qg4q316WEiKxzM23VdUujA
Abstract
In this paper, we develop a radar snow water equivalent (SWE) retrieval algorithm based on a parameterized forward model of bicontinuous dense media radiative transfer (Bic-DMRT). The algorithm is based on retrieving the absorption loss of the snowpack which is directly proportional to the SWE. In the algorithm, Bic-DMRT is first applied to generate a lookup table (LUT) of snowpack backscattering at X- and Ku-band. Regression training is applied to the LUT to transform the dual-frequency backscatter into functions of two parameters: the scattering albedo at X-band and SWE. The background scattering is subtracted from the SnowSAR data to give the volume scattering of snow. Classification of SnowSAR data is applied to provide a priori information. Based on the obtained volume scattering and the priori information, a cost function is established to find SWE. Performance of the retrieval algorithm was tested using three sets of airborne SnowSAR data acquired over mixed areas in Finland and ...
Authorship
Zhu, J., Tan, S., King, J., Derksen, C., Lemmetyinen, J., & Tsang, L.
Citation
Zhu, J., Tan, S., King, J., Derksen, C., Lemmetyinen, J., & Tsang, L. (2018). Forward and inverse radar modeling of terrestrial snow using SnowSAR data. IEEE Transactions on Geoscience and Remote Sensing, 56(12), 7122-7132. https://doi.org/10.1109/TGRS.2018.2848642
PublicationType
Journal Article
Year
2018
146 / 292
Publication 1.0
T-2024-04-02-H1SzI8QbhcES7uCB27yn5BA
Abstract
Flow management has the potential to significantly affect ecosystem condition. Shallow lakes in arid regions are especially susceptible to flow management changes, which can have important implications for the formation of cyanobacterial blooms. Here, we reveal water quality shifts associated with changing source water inflow management. Using in situ monitoring data, we studied a seven-year time span during which inflows to a shallow, eutrophic drinking water reservoir transitioned from primarily natural landscape runoff (2014–2015) to managed flows from a larger upstream reservoir (Lake Diefenbaker; 2016–2020) and identified significant changes in cyanobacteria (as phycocyanin) using generalized additive models to classify cyanobacterial bloom formation. We then connected changes in water source with shifts in chemistry and the occurrence of cyanobacterial blooms using principal components analysis. Phycocyanin was greater in years with managed reservoir inflow from a mesotrophic ups ...
Authorship
Baulch, H.
Citation
Baulch, H. (2023) From land to water: managing nutrient loss from agricultural lands in the prairies. Soils and crops.
Project
GWF-AWF: Agricultural Water Futures|GWF-FORMBLOOM: Forecasting Tools and Mitigation Options for Diverse Bloom-Affected Lakes|GWF-PW: Prairie Water|
PublicationType
Conference Presentation
Year
2023
147 / 292
Publication 1.0
T-2021-11-14-d1VpC4gJ1sUmIN9U62Oqbfw
Abstract
Smart packaging of fresh produce is an emerging technology toward reduction of waste and preservation of consumer health and safety. Smart packaging systems also help to prolong the shelf life of perishable foods during transport and mass storage, which are difficult to regulate otherwise. The use of these ever-progressing technologies in the packaging of fruits has the potential to result in many positive consequences, including improved fruit quality, reduced waste, and associated improved public health. In this review, we examine the role of smart packaging in fruit packaging, current-state-of-the-art, challenges, and prospects. First, we discuss the motivation behind fruit quality monitoring and maintenance, followed by the background on the development process of fruits, factors used in determining fruit quality, and the classification of smart packaging technologies. Then, we discuss conventional freshness sensors for packaged fruits including direct and indirect freshness indica ...
Authorship
Alam, A. U., Rathi, P., Beshai, H., Sarabha, G. K., & Deen, M. J.
Citation
Alam, A. U., Rathi, P., Beshai, H., Sarabha, G. K., & Deen, M. J. (2021). Fruit quality monitoring with smart packaging. Sensors, 21(4), 1509. https://doi.org/10.3390/s21041509
Project
GWF-SSSWQM: Sensors and Sensing Systems for Water Quality Monitoring|
PublicationType
Journal Article
Year
2021
148 / 292
Publication 1.0
T-2025-09-28-p1f4D3tBoSEiIAo7dIJ0RZA
Abstract
DNA aptamers for small molecules hold transformative promise in biosensing, diagnostics, and therapeutics, yet their in vitro evolution has been hampered by incomplete knowledge of the parameters that drive efficient enrichment. In recent years, the development of library-immobilization based method, so called capture-SELEX, has generated over 100 high-quality DNA aptamers for various types of small molecules. Importantly, capture-SELEX allows systematic investigation of fundamental problems in the selection of aptamers. This thesis studies the capture-SELEX platform by dissecting thermodynamic, kinetic, and methodological variables to accelerate the discovery of high-affinity DNA aptamers. Using adenosine/ATP as targets for selection has repeatedly produced the same guanine-rich aptamer motif that was first reported by the Szostak group in 1995. This aptamer has been considered as the adenosine/ATP aptamer by the field. First, by gradually increasing the selection stringency on classi ...
Authorship
Ding, Y.
Project
GWF-SSSWQM: Sensors and Sensing Systems for Water Quality Monitoring|
PublicationType
Thesis
Year
2025
149 / 292
Publication 1.0
T-2021-11-14-j1dyvNYe8MUm0bw29zj1c7Zw
Abstract
Fluvial systems in southern Ontario are regularly affected by widespread early-spring flood events primarily caused by rain-on-snow events. Recent studies have shown an increase in winter floods in this region due to increasing winter temperature and precipitation. Streamflow simulations are associated with uncertainties mainly due to the different scenarios of greenhouse gas emissions, global climate models (GCMs) or the choice of the hydrological model. The internal variability of climate, defined as the chaotic variability of atmospheric circulation due to natural internal processes within the climate system, is also a source of uncertainties to consider. Uncertainties of internal variability can be assessed using hydrological models fed by downscaled data of a global climate model large ensemble (GCM-LE), but GCM outputs have too coarse of a scale to be used in hydrological modeling. The Canadian Regional Climate Model Large Ensemble (CRCM5-LE), a 50-member ensemble downscaled from ...
Authorship
Champagne O., Arain, M.A., Leduc, M., Coulibaly P., McKenzie S.
Citation
Champagne O., Arain, M.A., Leduc, M., Coulibaly P., McKenzie S., 2020. Future shift in winter streamflow modulated by the internal variability of climate in southern Ontario. Hydrology and Erath System Sciences, 24(6): 3077-3096. https://doi.org/10.5194/hess-24-3077-2020.
Project
GWF-SFWF: Southern Forests Water Futures|
PublicationType
Journal Article
Year
2020
150 / 292
Publication 1.0
T-2022-12-03-G1h8G1Y3L51kSyctF0Qz2dRQ
Abstract
Time series of wetland methane fluxes measured by eddy covariance require gap-filling to estimate daily, seasonal, and annual emissions. Gap-filling methane fluxes is challenging because of high variability and complex responses to multiple drivers. To date, there is no widely established gap-filling standard for wetland methane fluxes, with regards both to the best model algorithms and predictors. This study synthesizes results of different gap-filling methods systematically applied at 17 wetland sites spanning boreal to tropical regions and including all major wetland classes and two rice paddies. Procedures are proposed for: 1) creating realistic artificial gap scenarios, 2) training and evaluating gap-filling models without overstating performance, and 3) predicting half-hourly methane fluxes and annual emissions with realistic uncertainty estimates. Performance is compared between a conventional method (marginal distribution sampling) and four machine learning algorithms. The conv ...
Authorship
Irvin, J., Zhou, S., McNicol, G. et al. incl. Helbig, M., Sonnentag, O.
Citation
Irvin, J., Zhou, S., McNicol, G. et al. incl. Helbig, M., Sonnentag, O.: Gap-filling eddy covariance methane fluxes: Comparison of machine learning model predictions and uncertainties at FLUXNET-CH4 wetlands, Agricultural and Forest Meteorology, 308-309, 108528, https://doi.org/10.1016/j.agrformet.2021.108528, 2021
Project
GWF-NWF: Northern Water Futures|
PublicationType
Journal Article
Year
2021
151 / 292
Publication 1.0
T-2022-12-03-g1ELhrhMq5EuPifg16x5MKHw
Abstract
Aquatic environments with high levels of dissolved ferrous iron and low levels of sulfate serve as an important systems for exploring biogeochemical processes relevant to the early Earth. Boreal Shield lakes, which number in the tens of millions globally, commonly develop seasonally anoxic waters that become iron rich and sulfate poor, yet the iron–sulfur microbiology of these systems has been poorly examined. Here we use genome-resolved metagenomics and enrichment cultivation to explore the metabolic diversity and ecology of anoxygenic photosynthesis and iron/sulfur cycling in the anoxic water columns of three Boreal Shield lakes. We recovered four high-completeness and low-contamination draft genome bins assigned to the class Chlorobia (formerly phylum Chlorobi) from environmental metagenome data and enriched two novel sulfide-oxidizing species, also from the Chlorobia. The sequenced genomes of both enriched species, including the novel “Candidatus Chlorobium canadense”, encoded the ...
Authorship
Tsuji, J.M., N. Tran, S.L. Schiff, J.J. Venkiteswaran, L.A. Molot and J.D. Neufeld.
Citation
Tsuji, J.M., N. Tran, S.L. Schiff, J.J. Venkiteswaran, L.A. Molot and J.D. Neufeld. 2020. Genomic potential for photoferrotrophy in a seasonally anoxic Boreal Shield lake. The ISME Journal, https://doi.org/10.1038/s41396-020-0725-0.
Project
GWF-FORMBLOOM: Forecasting Tools and Mitigation Options for Diverse Bloom-Affected Lakes|
PublicationType
Journal Article
Year
2020
152 / 292
Publication 1.0
T-2023-01-04-c1xUlsIYdTEK9RaUqlCyTqw
Abstract
Changes in the frequency and intensity of extreme precipitation resulting from climate change are responsible for natural disasters such as severe floods and have been a major study focus during the last decades. Previous studies have mainly focused on the trends of annual maxima precipitation at global and regional scales. However, little is known about how extreme precipitation trends change among different climate types. This study offers a global analysis of extreme precipitation changes in terms of climate type by using over 8500 gauge-based records. We focus on the period 1964 to 2013 when global warming was accelerating. A climate type is assigned to each station based on the Köppen Geiger (KG) climate classification, resulting in 30 KG climate subtypes. Mann-Kendall test and Sen’s slope estimator are applied to each time series, measuring the magnitude and significance of trends. The heaviness of the tail for each station is assessed based on the shape parameter of the Generali ...
Authorship
Hobbi, S., Nerantzaki, S., Papalexiou, S.M., Rajulapati, C.R.
Citation
Hobbi, S., Nerantzaki, S., Papalexiou, S.M., Rajulapati, C.R., 2022. Global analysis of extreme precipitation changes in the Koumlppen-Geiger climate classification. EGU22, Copernicus Meetings. https://doi.org/10.5194/egusphere-egu22-10335?
Project
GWF-Paradigm Shift in Downscaling Climate Model Projections|
PublicationType
Conference Presentation
Title
Global analysis of extreme precipitation changes in the Koumlppen-Geiger climate classification
Year
2022
153 / 292
Publication 1.0
T-2024-12-19-R1gC9ddgR1iU6v9dc4wfSbFw
Abstract
Climate change is contributing to extreme climate events such as prolonged heat waves, hurricanes, and flooding. Climate classification schemes have become critical tools in investigating these events. One of the most widely used schemes is the Köppen-Geiger (KG) classification, which groups the world’s climate types using multiple variables based on precipitation and temperature data. Studies that apply the KG classification have a variety of purposes, including to present the geographical distribution of climate types, to measure shifts among climate types, to study changes in extreme events at regional scales, and to present future projections of climate types. However, several aspects of KG classification have not been thoroughly investigated in the literature: First, few studies have explored the differences among climate types at the global scale derived from multiple sources of precipitation and temperature data; second, little research has looked at changes in extreme precipita ...
Authorship
Hobbi, Salma
Citation
Hobbi, Salma (2021) Global characteristics of extreme precipitation and variation of climate types from Köppen-Geiger classification using different datasets, USASK Harvest - Theses and Dissertations, https://hdl.handle.net/10388/13492
PublicationType
Thesis
Title
Global characteristics of extreme precipitation and variation of climate types from Köppen-Geiger classification using different datasets
Year
2021
154 / 292
Publication 1.0
T-2024-12-19-J1J2HjZ05HwEJ2iHNH2J2DM6iA
Abstract
A graphical analysis method is applied over the province of Alberta, Canada using publicly available water level data from standard monitoring wells to evaluate and categorize aquifer recovery. Agriculture in the province relies heavily upon surface water for irrigation, which is increasingly unreliable due to climate change and increasing climate variability. Due to an expected future reliance on groundwater, it is necessary to better understand groundwater flow and aquifer characteristics across Alberta to prevent over-allocation of groundwater resources. Water level data from provincial monitoring well hydrographs are examined and graphically analyzed to broadly characterize recovery in agriculturally significant regions of the province of Alberta, Canada. Through this analysis, the presence of a recharge boundary within a recovery curve can be ascertained. Of the 292 monitoring wells originally screened, recovery curve analysis is conducted on 49 monitoring wells. Using graphical a ...
Authorship
Brunet, Melanie
Citation
Brunet, Melanie (2024) Graphical Analysis of Publicly Available Monitoring Well Databases to Evaluate and Categorize Groundwater Recovery Across Alberta, Canada, UWSpace - Theses, https://hdl.handle.net/10012/20972
PublicationType
Thesis
Year
2024
155 / 292
Publication 1.0
T-2023-01-04-l1tb8658XaUmHJ3JUfR8JKw
Abstract
New members of a software team can struggle to locate user requirements if proper software engineering principles are not practiced. Reading through code, finding relevant methods, classes and files take a significant portion of software development time. Many times developers have to fix issues in code written by others. Having a good tool support for this code browsing activity can reduce human effort and increase overall developers' productivity. To help program comprehension activities, building an abstract code summary of a software system from the call graph is an active research area. A call graph is a visual representation of caller-callee relationships between different methods of a software project. Call graphs can be difficult to comprehend for a larger code-base. The motivation is to extract the essence from the call graph by finding execution scenarios from a call graph and then cluster them together by concentrating the information in the code-base. Later, different techn ...
Authorship
Bhattacharjee Avijit
Citation
Bhattacharjee Avijit, HCPC: Human centric program comprehension by grouping static execution scenarios, June 2021. Co-supervisors: BRoy and Schneider
Project
GWF-CS: Computer Science|
PublicationType
Thesis
Year
2021
156 / 292
Publication 1.0
T-2022-12-03-31FUn1q315bkijZzBAiKj31dw
Abstract
Permafrost thaw has been observed in recent decades in the Northern Hemisphere and is expected to accelerate with continued global warming. Predicting the future of permafrost requires proper representation of the interrelated surface/subsurface thermal and hydrologic regimes. Land surface models (LSMs) are well suited for such predictions, as they couple heat and water interactions across soil-vegetation-atmosphere interfaces and can be applied over large scales. LSMs, however, are challenged by the long-term thermal and hydraulic memories of permafrost and the paucity of historical records to represent permafrost dynamics under transient climate conditions. In this study, we aim to understand better how LSMs function under different spin-up states, which facilitates addressing the challenge of model initialization by characterizing the impact of initial climate conditions and initial soil frozen and liquid water contents on the simulation length required to reach equilibrium. Further ...
Authorship
Abdelhamed, M. S., Elshamy, M. E., Wheater, H. S., & Razavi, S.
Citation
Abdelhamed, M. S., Elshamy, M. E., Wheater, H. S., & Razavi, S. (2022). Hydrologic-land surface modelling of the Canadian sporadic-discontinuous permafrost: initialization and uncertainty propagation. Hydrological Processes, 36(3), 1-22, https://doi.org/10.1002/hyp.14509
Project
GWF-IMPC: Integrated Modelling Program for Canada|
PublicationType
Journal Article
Year
2022
157 / 292
Publication 1.0
T-2021-11-14-u13VXKtEBiUu2qnu2dGFxtRKw
Abstract
Evolutionary coupling is a well investigated phenomenon in software maintenance research and practice. Association rules and two related measures, support and confidence, have been used to identify evolutionary coupling among program entities. However, these measures only emphasize the co-change (i.e., changing together) frequency of entities and cannot determine whether the entities co-evolved by experiencing related changes. Consequently, the approach reports false positives and fails to detect evolutionary coupling among infrequently co-changed entities. We propose a new measure, identifier correspondence (id-correspondence), that quantifies the extent to which changes that occurred to the co-changed entities are related based on identifier similarity. Identifiers are the names given to different program entities such as variables, methods, classes, packages, interfaces, structures, unions etc. We use Dice-Sørensen co-efficient for measuring lexical similarity between the identifier ...
Authorship
Mondal, M., Roy, B., Roy, C. K., & Schneider, K. A.
Citation
Mondal, M., Roy, B., Roy, C. K., & Schneider, K. A. (2021). ID-correspondence: a measure for detecting evolutionary coupling. Empirical Software Engineering, 26(1), 1-34. https://doi.org/10.1007/s10664-020-09921-9
Project
GWF-CS: Computer Science|
PublicationType
Journal Article
Year
2021
158 / 292
Publication 1.0
T-2024-07-18-W1ptzcfiqYEG5GUUW27Ykp6g
Authorship
Merchant, M., Obadia, M., Mahdianpari, M., Bourgeau-Chavez, L., Brisco, B., DeVries, B., Berg, A.A.
Citation
Merchant, M., Obadia, M., Mahdianpari, M., Bourgeau-Chavez, L., Brisco, B., DeVries, B., Berg, A.A. (2023) Ice-wedge polygon classification with deep learning: evaluation of hybrid compact polarimetric RADARSAT constellation mission and arcticDEM.
Project
GWF-NWF: Northern Water Futures|
PublicationType
Journal Article
Title
Ice-wedge polygon classification with deep learning: evaluation of hybrid compact polarimetric RADARSAT constellation mission and arcticDEM
Year
2023
159 / 292
Publication 1.0
T-2022-12-05-W1W1UhSBXiqUOjiDZbBnu02Q
Abstract
Phragmites australis (Cav.) Trin. ex Steudel subspecies australis is one of the worst plant invaders in wetlands of North America. Remote sensing is the most cost-effective method to track its spread given its widespread distribution and rapid colonization rate. We hypothesize that the morphological and/or physiological features associated with different phenological states of Phragmites can influence their reflectance signal and thus affect mapping accuracies. We tested this hypothesis by comparing classification accuracies of cloud-free images acquired by Landsat 7, Landsat 8, and Sentinel 2 at roughly monthly intervals over a calendar year for two wetlands in southern Ontario. We used the Support Vector Machines classification and employed field observations and image acquired from unmanned aerial vehicle (8 cm) to perform accuracy assessments. The highest Phragmites producer’s, user’s, and overall accuracy (96.00, 91.11, and 88.56% respectively) were provided by images acquired in ...
Authorship
Rupasinghe, P. A., & Chow-Fraser, P.
Citation
Rupasinghe, P. A., & Chow-Fraser, P. (2019). Identification of most spectrally distinguishable phenological stage of invasive Phramites australis in Lake Erie wetlands (Canada) for accurate mapping using multispectral satellite imagery. Wetlands Ecology and Management, 27(4), 513-538. https://doi.org/10.1007/s11273-019-09675-2
PublicationType
Journal Article
Year
2019
160 / 292
Publication 1.0
T-2024-02-20-P15T9s8BQB0CwQqvIJtRXzw
Abstract
Streamflow in Western North America (WNA) has been experiencing pronounced changes in terms of volume and timing over the past century, primarily driven by natural climate variability and human-induced climate changes. This thesis advances on previous work by revealing the most recent streamflow changes in WNA using a comprehensive suite of classical hydrometric methods along with novel Deep Learning (DL) based approaches for change detection and classifica- tion. More than 500 natural streams were included in the analysis across western Canada and the United States. Trend analyses based on the Mann-Kendall test were conducted on a wide selection of classic hydrometric indicators to represent varying aspects of streamflow over 43 years from 1979 to 2021. A general geograph- ical divide at approximately 46◦N degrees latitude indicates that total streamflow is increasing to the north while declining to the south. Declining late summer flows (July–September) were also widespread across th ...
Authorship
Tang, W.
Citation
Tang, W. (2022) Identifying streamflow changes in western North America from 1979 to 2021 using Deep Learning approaches. PhD Thesis, McMaster University. https://macsphere.mcmaster.ca/handle/11375/28030
Project
GWF-MWF: Mountain Water Futures|
PublicationType
Thesis
Year
2022
161 / 292
Publication 1.0
T-2024-07-18-Q1kEIUQ2DDyE6bo4AhLeYsbQ1
Authorship
Umair, M., Melton, J.R., Roy, A., et al.
Citation
Umair, M., Melton, J.R., Roy, A., et al. (2023) Implementation of plant hydraulics in the Canadian land surface scheme including biogeochemical cycles (CLASSIC).
Project
GWF-NWF: Northern Water Futures|
PublicationType
Journal Article
Title
Implementation of plant hydraulics in the Canadian land surface scheme including biogeochemical cycles (CLASSIC)
Year
2023
162 / 292
Publication 1.0
T-2023-01-20-C122uclOgVUGwNh1kRsj1MQ
Authorship
Fassnacht, S.R. and E.D. Soulis
Citation
Fassnacht, S.R. and E.D. Soulis, (2002). Implications during transitional periods of improvements to the snow processes in the land surface scheme – hydrological model WATCLASS. Atmosphere-Ocean, 40, 389-403.
PublicationType
Journal Article
Title
Implications during transitional periods of improvements to the snow processes in the land surface scheme – hydrological model WATCLASS
Year
2002
163 / 292
Publication 1.0
T-2021-11-14-K16Cn34Ojg0emrrXx7WMVrQ
Abstract
The collection efficiency of a typical precipitation gauge-shield configuration decreases with increasing wind speed, with a high scatter for a given wind speed. The high scatter in the collection efficiency for a given wind speed arises in part from the variability in the characteristics of falling snow and atmospheric turbulence. This study uses weighing gauge data collected at the Marshall Field Site near Boulder, Colorado, during the WMO Solid Precipitation Intercomparison Experiment (SPICE). Particle diameter and fall speed data from a laser disdrometer were used to show that the scatter in the collection efficiency can be reduced by considering the fall speed of solid precipitation particles. The collection efficiency was divided into two classes depending on the measured mean-event particle fall speed during precipitation events. Slower-falling particles were associated with a lower collection efficiency. A new transfer function (i.e., the relationship between collection efficie ...
Authorship
Leroux, N. R., Thériault, J. M., & Rasmussen, R.
Citation
Leroux, N. R., Thériault, J. M., & Rasmussen, R. (2021). Improvement of snow gauge collection efficiency through a knowledge of solid precipitation fall speed. Journal of Hydrometeorology, 22(4), 997-1006. https://doi.org/10.1175/JHM-D-20-0147.1
Project
GWF-SPADE: Storms and Precipitation Across the Continental Divide Experiment|
PublicationType
Journal Article
Year
2021
164 / 292
Publication 1.0
T-2022-12-05-l1gDsGc169Ul2MK9tTsamD7A
Abstract
Conventional assessment and evaluation of sediment quality are based on laboratory-based ecotoxicological and chemical measurements with lack of concern for ecological relevance. Microbiotas in sediment are responsive to pollutants and can be used as alternative ecological indicators of sediment pollutants; however, the linkage between the microbial ecology and ecotoxicological endpoints in response to sediment contamination has been poorly evaluated. Here, in situ microbiotas from the Three Gorges Reservoir (TGR) area of the Yangtze River were characterized by DNA metabarcoding approaches, and then, changes of in situ microbiotas were compared with the ecotoxicological endpoint, aryl hydrocarbon receptor (AhR) mediated activity, and level of polycyclic aromatic hydrocarbons (PAHs) in sediments. PAHs and organic pollutant mixtures mediating AhR activity had different effects on the structures of microbiotas. Specifically, Shannon indices of protistan communities were negatively correla ...
Authorship
Xie, Y., Floehr, T., Zhang, X., Xiao, H., Yang, J., Xia, P., Burton Jr, G. A. & Hollert, H.
Citation
Xie, Y., Floehr, T., Zhang, X., Xiao, H., Yang, J., Xia, P., Burton Jr, G. A. & Hollert, H. (2018). In situ microbiota distinguished primary anthropogenic stressor in freshwater sediments. Environmental Pollution, 239, 189-197. https://doi.org/10.1016/j.envpol.2018.03.099
PublicationType
Journal Article
Year
2018
165 / 292
Publication 1.0
T-2022-12-03-g1Q6O7lc7ZEGXZBg37fT88aA
Abstract
With the increasing availability of SAR imagery in recent years, more research is being conducted using deep learning (DL) for the classification of ice and open water; however, ice and open water classification using conventional DL methods such as convolutional neural networks (CNNs) is not yet accurate enough to replace manual analysis for operational ice chart mapping. Understanding the uncertainties associated with CNN model predictions can help to quantify errors and, therefore, guide efforts on potential enhancements using more–advanced DL models and/or synergistic approaches. This paper evaluates an approach for estimating the aleatoric uncertainty [a measure used to identify the noise inherent in data] of CNN probabilities to map ice and open water with a custom loss function applied to RADARSAT–2 HH and HV observations. The images were acquired during the 2014 ice season of Lake Erie and Lake Ontario, two of the five Laurentian Great Lakes of North America. Operational image ...
Authorship
Saberi, N., Scott, K. A., & Duguay, C.
Citation
Saberi, N., Scott, K. A., & Duguay, C. (2022). Incorporating Aleatoric Uncertainties in Lake Ice Mapping Using RADARSAT-2 SAR Images and CNNs. Remote Sensing, 14(3), 644. https://doi.org/10.3390/rs14030644
Project
GWF-TSTSW: Transformative Sensor Technologies and Smart Watersheds|GWF-CORE: Core Modelling and Forecasting|
PublicationType
Journal Article
Year
2022
166 / 292
Publication 1.0
T-2024-12-19-Z1druZ3UpgB0W1bwQWHQfwtQ
Abstract
Abstract: Herbicides and safeners have been formulated together to help protect crop plants from the injurious effects of herbicides while maintaining the ability of the herbicides to selectively remove targeted weeds. These groups of compounds became important as agriculture increased to sustain the world's ever-increasing population. Selected emerging safeners (SESs), Mefenpyr di-ethyl (MEF) and Cyprosulfamide (CPS) and their co-herbicides (Fenoxaprop-p-ethyl (FEN) and Isoxaflutole (ISO)) used during pre- and post-emergence of cereals and grains were used for this study. The mobility of safeners varied in the environment in relation to their chemical properties, such as octanol-water solubility partition coefficient. Herbicides and safeners have been found in the aquatic environment because they could dissipate from the point of application through leaching, surface runoff, and volatilization. The sorption of safeners such as CPS to soil was found to be governed by soil pH. Hence, th ...
Authorship
Femi-Oloye, Oluwabunmi Peace
Citation
Femi-Oloye, Oluwabunmi Peace (2023) Individual and Combined Effects of Selected Emerging Safeners: Mefenpyr di-ethyl and Cyprosulfamide and their Co-Herbicides, Fenoxaprop-P-ethyl and Isoxaflutole on Daphnia magna and Danio rerio, USASK Harvest - Theses and Dissertations, https://hdl.handle.net/10388/15246
PublicationType
Thesis
Year
2023
167 / 292
Publication 1.0
T-2025-08-19-W1g1SyhrJJEW1W1z4h1DBeyvg
Abstract
Infrared (IR) is an important data source for satellite quantitative precipitation estimation, and has been widely applied in the fields of meteorology, hydrology, and agriculture. In the past decades, a series of IR retrieval algorithms have been developed to support the production of IR-based and IR-microwave merged precipitation products. Recently, deep learning techniques such as the convolutional neural network (CNN) show great potential in obtaining IR precipitation estimates with higher accuracy than traditional retrieval algorithms. In this study, we present an upgraded version of IR Precipitation Estimation using CNN (IPEC), i.e., IPEC version 2 (IPEC-V2), with a new end-to-end manner. IPEC-V2 is used to generate a precipitation dataset based on IR data from China’s Fengyun (FY) geostationary satellites (FY-2F, 2G, and 4A). To overcome the difficulty of model training in regions with sparse observations, IPEC-V2 models are firstly pre-trained over the data-rich Continental US ...
Authorship
Wang, C., Tang, G., Xiong, W., Ma, Z., Zhu, S.
Project
GWF-MWF: Mountain Water Futures|
PublicationType
Journal Article
Year
2021
168 / 292
Publication 1.0
T-2025-10-24-q1EMDrnlDX0WrkfKokcPiJQ
Abstract
We advance methodologies for monitoring ground surface freeze/thaw (F/T) detection, integrating laboratory pedology, field observations, and satellite remote sensing (RS) to enhance terrestrial cryosphere monitoring. The thesis addresses critical gaps stemming from reliance on static, intrinsic thresholds for F/T classification, advocating for and developing more accurate, scalable, and context-adaptive methods through a multiscale approach. Beginning with detailed characterization of soil moisture sensors in frozen, thawed, and transitional states in the laboratory, Chapter 2 introduces permittivity-based soil freezing characteristic curves (SFCCs) in agricultural fields. This approach improves the accuracy of F/T detection and deepens our understanding of the dynamics involved, serving as a tool for monitoring water resources in cold climate agriculture. The analysis in Chapter 3 reveals that the scale and location of soil moisture measurements can significantly influence the shape o ...
Authorship
Pardo Lara, R.
Project
GWF-TSTSW: Transformative Sensor Technologies and Smart Watersheds|
PublicationType
Thesis
Year
2025
169 / 292
Publication 1.0
T-2021-11-14-j16I9EJj3SPkaU6TN5j3GJutA
Abstract
During the past few decades, contamination of sediments by persistent toxic substances (PTSs) has been observed in estuarine and coastal areas on the west coast of South Korea. The contaminants are suspected to cause toxicities in aquatic biota, but little is known about their ecological effects, particularly on benthic microbial communities. In this study, an eDNA-based assessment was applied along with classic assessments of exposure, such as chemistry and in vitro bioassays, to evaluate condition of benthic bacterial communities subjected to PTSs. Two strategies were adopted for the study. One was to conduct a comprehensive assessment in space (by comparing seawater and freshwater sites at five coastal regions) and in time (by following change over a 5-y period). Although we found that bacterial composition varied among and within years, some phyla, such as Proteobacteria (28.7%), Actinobacteria (13.1%), Firmicutes (12.7%), and Chloroflexi (12.5%) were consistently dominated across ...
Authorship
Lee, A. H., Lee, J., Hong, S., Kwon, B. O., Xie, Y., Giesy, J. P., ... & Khim, J. S.
Citation
Lee, A. H., Lee, J., Hong, S., Kwon, B. O., Xie, Y., Giesy, J. P., ... & Khim, J. S. (2020). Integrated assessment of west coast of South Korea by use of benthic bacterial community structure as determined by eDNA, concentrations of contaminants, and in vitro bioassays. Environment international, 137, 105569. https://doi.org/10.1016/j.envint.2020.105569
Project
GWF-NGS: Next Generation Solutions for Healthy Water Resources|
PublicationType
Journal Article
Year
2020
170 / 292
Publication 1.0
T-2024-12-19-c14jGW9QgBkGSGmIIc2ijGzA
Abstract
Talus and moraine serve as vital groundwater reservoirs, with their associated capability to modulate the baseflow of major rivers that originate in headwater environments. Recent field-based studies conducted in the Canadian Rocky Mountains have identified a nonlinear storage-discharge relationship expressed by these surficial alpine aquifers and the importance of their spatial positioning and extent in headwater environments. However, few studies have tried to upscale our current small-scale understanding of these surficial units, to better understand how their storage-discharge dynamics influence basin-scale (i.e. 10^3-10^4 km^2) hydrology. This study aimed to develop a means to integrate several representative features associated with alpine aquifers into a basin-scale hydrological model to potentially improve its capability to estimate and predict the baseflow of mountain rivers. Specifically, this study developed a simple object-oriented image classification workflow to map the s ...
Authorship
Ralph, Brayden Maxwell
Citation
Ralph, Brayden Maxwell (2024) Integrating Field-Based Knowledge of Alpine Aquifers in Basin-Scale Hydrological Models, University of Calgary PRISM - Theses and Dissertations, https://doi.org/10.11575/PRISM/42814
PublicationType
Thesis
Year
2024
171 / 292
Publication 1.0
T-2023-01-21-v1nt22qjgcUGSSXGzF1RWbA
Authorship
Kamali M., K. Ponnambalam, and E. Soulis.
Citation
Kamali M., K. Ponnambalam, and E. Soulis. (2007). Integration of surrogate optimization and pca for calibration of hydrologic models, a WATCLASS case study. Systems, Man and Cybernetics, ISIC. IEEE International Conference. pp2733-2737
PublicationType
Conference Proceeding
Title
Integration of surrogate optimization and pca for calibration of hydrologic models, a WATCLASS case study
Year
2007
172 / 292
Publication 1.0
T-2024-12-19-l18l1n6Ed87UuTQfGl1PTmOwA
Abstract
Groundwater vulnerability assessments, often presented in the form of a thematic map, provide a measure of the relative susceptibility of a groundwater system to contamination introduced at or near the ground surface. However, most groundwater vulnerability assessments rely on deterministic, point estimates based on averaged input parameters, and result in a single output value without any indication of the uncertainty or variation around this value. To facilitate the most effective application and interpretation of groundwater vulnerability assessments, a method for incorporating the uncertainty associated with the natural variation of input parameters into groundwater vulnerability assessments was developed and demonstrated in south-central Saskatchewan. A comprehensive literature review and synthesis, including a review of the conceptual basis of intrinsic groundwater vulnerability assessment methods, a critical evaluation of common and representative methods, and a review of the cu ...
Authorship
Ferris, David Milo
Citation
Ferris, David Milo (2019) Intrinsic groundwater vulnerability assessments: A review of the state-of-the-art and a statistical approach to incorporating uncertainty into groundwater vulnerability assessments, USASK Harvest - Theses and Dissertations, http://hdl.handle.net/10388/12295
PublicationType
Thesis
Year
2019
173 / 292
Publication 1.0
T-2023-02-08-y1tBUzhtoUkuI94iz899udg
Abstract
Groundwater vulnerability assessments, often presented in the form of a thematic map, provide a measure of the relative susceptibility of a groundwater system to contamination introduced at or near the ground surface. However, most groundwater vulnerability assessments rely on deterministic, point estimates based on averaged input parameters, and result in a single output value without any indication of the uncertainty or variation around this value. To facilitate the most effective application and interpretation of groundwater vulnerability assessments, a method for incorporating the uncertainty associated with the natural variation of input parameters into groundwater vulnerability assessments was developed and demonstrated in south-central Saskatchewan. A comprehensive literature review and synthesis, including a review of the conceptual basis of intrinsic groundwater vulnerability assessment methods, a critical evaluation of common and representative methods, and a review of the cu ...
Authorship
Ferris, David
Citation
Ferris, David (2019). Intrinsic groundwatervulnerabilityassessments: A review of the state-of-the-art and a statistical approach to incorporating uncertainty into groundwater vulnerability assessment http://hdl.handle.net/10388/12295
Project
GWF-PW: Prairie Water|
PublicationType
Thesis
Year
2019
174 / 292
Publication 1.0
T-2021-11-14-r14r20cu62dEOqr2r2r1XmCr1VGw
Abstract
Despite the high historical losses attributed to flood events, Canadian flood mitigation efforts have been hindered by a dearth of current, accessible flood extent/risk models and maps. Such resources often entail large datasets and high computational requirements. This study presents a novel, computationally efficient flood inundation modeling framework (“InundatEd”) using the height above nearest drainage (HAND)-based solution for Manning's equation, implemented in a big-data discrete global grid system (DGGS)-based architecture with a web-GIS (Geographic Information Systems) platform. Specifically, this study aimed to develop, present, and validate InundatEd through binary classification comparisons to recently observed flood events. The framework is divided into multiple swappable modules including GIS pre-processing; regional regression; inundation models; and web-GIS visualization. Extent testing and processing speed results indicate the value of a DGGS-based architecture alongsi ...
Authorship
Chaudhuri, C., Gray, A., & Robertson, C.
Citation
Chaudhuri, C., Gray, A., & Robertson, C. (2021). InundatEd-v1.0: a height above nearest drainage (HAND)-based flood risk modeling system using a discrete global grid system. Geoscientific Model Development. 14, 3295-3315. https://doi.org/10.5194/gmd-14-3295-2021.
Project
GWF-GWC: Global Water Citizenship (Integrating Networked Citizens, Scientists and Local Decision Makers)|
PublicationType
Journal Article
Year
2021
175 / 292
Publication 1.0
T-2022-12-05-11zcIGgARrkKr0Ycgq12kiJg
Abstract
While designing a software system, minimizing coupling among program entities (such as files, classes, methods) is always desirable. If a software entity is coupled with many other entities, this might be an indication of poor software design because changing that entity will likely have ripple change effects on the other coupled entities. Evolutionary coupling, also known as change coupling, is a well investigated way of identifying coupling among program entities. Existing studies have investigated whether file level or class level evolutionary couplings are related with software bug-proneness. While these existing studies have mixed findings regarding the relationship between bug-proneness and evolutionary coupling, none of these studies investigated whether method level (i.e., function level for procedural languages) evolutionary coupling is correlated with bug-proneness. Investigation considering a finer granularity (i.e., such as method level granularity) can help us pinpoint whi ...
Authorship
Mondal, M., Roy, B., Roy, C. K., & Schneider, K. A.
Citation
Mondal, M., Roy, B., Roy, C. K., & Schneider, K. A. (2019c). Investigating the relationship between evolutionary coupling and software bug-proneness. In Proceedings of the 29th Annual International Conference on Computer Science and Software Engineering (pp. 173-182). https://dl.acm.org/doi/abs/10.5555/3370272.3370291
PublicationType
Journal Article
Year
2019
176 / 292
Publication 1.0
T-2022-11-28-m1JdqaMfm24EC9WBZeQvZgZw
Abstract
Assessment of remote sensing derived freeze/thaw products from L-band radiometry requires ground validation. There is growing interest in utilizing soil moisture networks to meet this validation requirement, although it remains unclear whether the current configuration of these networks is appropriate. To address this issue, a small-scale L-band radiometry study was conducted from November 2014 to April 2015 to capture F/T events. Soil moisture probes measuring soil temperature and real dielectric permittivity were installed within a surface-based L-band radiometer footprint vertically at the surface and horizontally at 2.5, 5 and 10 cm depths. A binary freeze/thaw product was derived using radiometer brightness temperatures and compared to the binary F/T classification using soil temperature, real dielectric permittivity and air temperature measurements. The results of the study found that shallow probe depths (vertical and 2.5 cm) resulted in an improvement in the radiometer F/T prod ...
Authorship
Williamson, M, T.R. Rowlandson, A.A. Berg, A. Roy, P. Toose, C. Derksen, L. Arnold, E. Tetlock.
Citation
Matthew Williamson, Tracy L. Rowlandson, Aaron A. Berg, Alexandre Roy, Peter Toose, Chris Derksen, Lauren Arnold, & Erica Tetlock (2018). L-band radiometry freeze/ thaw validation using air temperature and ground measurements. Remote Sensing Letters, 9(4), 403-410.
PublicationType
Journal Article
Year
2018
177 / 292
Publication 1.0
T-2022-12-05-S1IrouOdJLUaf7QS34S1sS3UGA
Abstract
The large stocks of soil organic carbon (SOC) in soils and deposits of the northern permafrost region are sensitive to global warming and permafrost thawing. The potential release of this carbon (C) as greenhouse gases to the atmosphere does not only depend on the total quantity of soil organic matter (SOM) affected by warming and thawing, but it also depends on its lability (i.e., the rate at which it will decay). In this study we develop a simple and robust classification scheme of SOM lability for the main types of soils and deposits in the northern permafrost region. The classification is based on widely available soil geochemical parameters and landscape unit classes, which makes it useful for upscaling to the entire northern permafrost region. We have analyzed the relationship between C content and C-CO2 production rates of soil samples in two different types of laboratory incubation experiments. In one experiment, ca. 240 soil samples from four study areas were incubated using t ...
Authorship
Peter Kuhry, Jiří Bárta, Daan Blok, Bo Elberling, Samuel Faucherre, Gustaf Hugelius,, Christian J. Jørgensen,a, Andreas Richter, Hana Šantrůčková, and Niels Weiss
Citation
Peter Kuhry, Jiří Bárta, Daan Blok, Bo Elberling, Samuel Faucherre, Gustaf Hugelius,, Christian J. Jørgensen,a, Andreas Richter, Hana Šantrůčková, and Niels Weiss (2020). Lability classification of soil organic matter in the northern permafrost region. Biogeosciences, 17, 361-379. https://doi.org/10.5194/bg-17-361-2020
PublicationType
Journal Article
Title
Lability classification of soil organic matter in the northern permafrost region
Year
2020
178 / 292
Publication 1.0
T-2022-04-24-z1xYM5dsxAkCNjS6WAurLnw
Abstract
Harmful Algal Bloom (HABs) reports have increased globally, where climate change is considered a primary driver. While the role of temperature and precipitation on bloom formation is well understood on HAB formation, lake ice remains understudied. Reduced ice duration periods may alter algal growth, extent, duration and timing due to earlier light penetration, shifts in mixing, and changes to thermal regimes. Northern lakes are at an elevated risk due to the greater rate of air temperature change at high latitudes. To determine the importance of lake ice in the prediction of HABs, an observational time series (2002-2019) was analyzed utilizing new remote sensing data products provided by the ESA CCI Lakes+ project to determine the potential link between lake ice (lake ice on-off DOY and lake ice duration), lake surface water temperature (LSWT; mean/max, peak LSWT DOY, LSWT anomaly days) and algal biomass parameters (mean and max chlorophyll-a (chl-a, a proxy of algal biomass), high chl ...
Authorship
Dallosch Michael, Duguay Claude, Kheyrollah Pour Homa
Citation
Michael Dallosch, Claude Duguay, Homa Kheyrollah Pour (2022). Lake Ice as a Predictor of Algal Biomass in North American Great Lakes. Proceedings of the GWF Annual Open Science Meeting, May 16-18, 2022.
Project
GWF-LF: Lake Futures|
PublicationType
Conference Poster
Year
2022
179 / 292
Publication 1.0
T-2022-12-05-n1kc6oTdNXUGyAWc3E22txw
Abstract
Changes to ice cover on lakes throughout the northern landscape has been established as an indicator of climate change and variability, expected to have implications for both human and environmental systems. Monitoring lake ice cover is also required to enable more reliable weather forecasting across lake-rich northern latitudes. Currently, the Canadian Ice Service (CIS) monitors lakes using synthetic aperture radar (SAR) and optical imagery through visual interpretation, with total lake ice cover reported weekly as a fraction out of ten. An automated method of classification would allow for more detailed records to be delivered operationally. In this research, we present an automatic ice-mapping approach which integrates unsupervised segmentation from the Iterative Region Growing using Semantics (IRGS) algorithm with supervised random forest (RF) labeling. IRGS first locally segments homogeneous regions in an image, then merges similar regions into classes across the entire scene. Rec ...
Authorship
Hoekstra, M., Jiang, M., Clausi, D. A., & Duguay, C.
Citation
Hoekstra, M., Jiang, M., Clausi, D. A., & Duguay, C. (2020). Lake Ice-Water Classification of RADARSAT-2 Images by Integrating IRGS Segmentation with Pixel-Based Random Forest Labeling. Remote Sensing, 12(9), 1425. https://doi.org/10.3390/rs12091425
PublicationType
Journal Article
Title
Lake Ice-Water Classification of RADARSAT-2 Images by Integrating IRGS Segmentation with Pixel-Based Random Forest Labeling
Year
2020
180 / 292
Publication 1.0
T-2022-12-05-f1OCmBGKf110G5CIjC7f2iYpg
Abstract
In this study we assess the total storage, landscape distribution, and vertical partitioning of soil organic carbon (SOC) stocks on the Brøgger Peninsula, Svalbard. This type of high Arctic area is underrepresented in SOC databases for the northern permafrost region. Physico-chemical, elemental, and radiocarbon (14C) dating analyses were carried out on thirty-two soil profiles. Results were upscaled using both a land cover classification (LCC) and a landform classification (LFC). Both LCC and LFC approaches provide weighted mean SOC 0–100 cm estimates for the study area of 1.0 ± 0.3 kg C m−2 (95% confidence interval) and indicate that about 68 percent of the total SOC storage occurs in the upper 30 cm of the soil, and about 10 percent occurs in the surface organic layer. Furthermore, LCC and LFC upscaling approaches provide similar spatial SOC allocation estimates and emphasize the dominant role of “vegetated area” (4.2 ± 1.6 kg C m−2) and “solifluction slopes” (6.7 ± 3.6 kg C m−2) in ...
Authorship
Wojcik, R., Palmtag, J., Hugelius, G., Weiss, N., & Kuhry, P.
Citation
Wojcik, R., Palmtag, J., Hugelius, G., Weiss, N., & Kuhry, P. (2019). Land cover and landform-based upscaling of soil organic carbon stocks on the Brøgger Peninsula, Svalbard. Arctic, Antarctic, and Alpine Research, 51(1), 40-57. https://doi.org/10.1080/15230430.2019.1570784
PublicationType
Journal Article
Year
2019
181 / 292
Publication 1.0
T-2024-04-11-B1jETMVRD5E63x3wqbVVpcQ
Abstract
Warming has led to widespread impacts on the landscape in northern ecosystems. Areas underlain by discontinuous permafrost are as highly susceptible to significant change as a result of permafrost thaw leading to ground subsidence. The Baker Creek watershed is a typical Taiga Shield landscape on permafrost, just north of Yellowknife in the Northwest Territories. In this region, bedrock outcrops are interspersed with lakes, wetlands, soil-filled lowlands, and forests. Permafrost is discontinuous across the landscape – while bedrock and the terrain beneath lakes and streams are permafrost-free, permafrost can be found in forested parts of the landscape, usually associated with peatlands and glaciolacustrine sediments. Across this landscape, we took intensive ground-based measurements characterizing land cover types by their depth of organic soil and frost table. Using archival aerial photographs and recent satellite imagery, we assessed changes in land cover between 1972 and 2017. Stro ...
Authorship
Sniderhan, A. E., Spence, C., Kokelj, S. V., Baltzer, J. L.
Citation
Sniderhan, A. E., Spence, C., Kokelj, S. V., Baltzer, J. L. (2022) Land cover change an indicator of net permafrost aggradation in a Taiga Shield landscape. ArcticNet Annual Scientific Meeting, Dec 2022. https://event.fourwaves.com/asm2022/abstracts/7a19be59-e45e-4856-99b4-46fb62a52662
Project
GWF-Hydrology - Ecology Feedbacks in the Arctic: Narrowing the Gap Between Theory and Models|
PublicationType
Conference Presentation
Year
2022
182 / 292
Publication 1.0
T-2025-04-16-0126ItKeNMUGLhY02oJ9ocEA
Abstract
Continental high latitudes have been warming at higher rates than the global average, causing substantial permafrost thaw with widespread effects on soils, vegetation, streamflow seasonality and land subsidence. Complex feedbacks are controlled by precipitation changes and soil hydraulic and thermal properties, amongst many factors. The Mackenzie River Basin (MRB) is the largest drainage basin in Canada (1.8x10⁶ km2), underlain by permafrost of various classes for most of its extent (70–80% by area). Changes to the MRB affect atmospheric feedback, inflows to the Arctic Ocean, and local environments and communities. This study aims to parameterize a land surface hydrology model (MESH) for the MRB to simulate the coevolution of hydrology and permafrost dynamics, and hence enable the investigation of future change impacts. MESH, designed to simulate cold region processes, couples energy and water exchanges and requires a deep soil profile and long spin-up periods to initialize the permafr ...
Authorship
Elshamy, M., Pomeroy, J. W, Pietroniro, A., Wheater, H., Abdelhamed, M,. Davison, B.
Project
GWF-CORE: Core Modelling and Forecasting|
PublicationType
Journal Article
Year
2025
183 / 292
Publication 1.0
T-2025-04-14-D13K0GBd6GkD2H8PSfM9irGQ
Abstract
Monitoring river ice is crucial for planning safe navigation routes, with ice–water classification being one of the most important tasks in ice mapping. While high-resolutions satellite imagery, such as synthetic aperture radar (SAR), is well-suited to this task, manual interpretation of these data is challenging due to the large data volume. Machine learning approaches are suitable methods to overcome this; however, training the models might not be time-effective when the desired result is a narrow structure, such as a river, within a large image. To address this issue, we proposed a model incorporating a graph neural network (GNN), called learnable weights graph convolution network (LWGCN). Focusing on the winters of 2017–2021 with emphasis on the Beauharnois Canal and Lake St Lawrence regions of the Saint Lawrence River. The model first converts the SAR image into graph-structured data using simple linear iterative clustering (SLIC) to segment the SAR image, then connecting the cent ...
Authorship
Qu, Y., Soleymani, A., Sudom, D. & Scott, K. A.
Project
GWF-Remotely Sensed Monitoring of Northern Lake Ice Using RADARSAT Constellation Mission and Cloud Computing|
PublicationType
Conference Proceeding
Title
Learnable Weight Graph Neural Network for River Ice Classification
Year
2025
184 / 292
Publication 1.0
T-2024-12-19-R1s9TYEKes0SR3QR1UJhGwcNQ
Abstract
Deep neural networks are prevalent in supervised learning for large amounts of tasks such as image classification, machine translation and even scientific discovery. Their success is often at the sacrifice of interpretability and generalizability. The increasing complexity of models and involvement of the pre-training process make the inexplicability more imminent. The outstanding performance when labeled data are abundant while prone to overfit when labeled data are limited demonstrates the difficulty of deep neural networks' generalizability to different datasets. This thesis aims to improve interpretability and generalizability by restricting representations. We choose to approach interpretability by focusing on attribution analysis to understand which features contribute to prediction on BERT, and to approach generalizability by focusing on effective methods in a low-data regime. We consider two strategies of restricting representations: (1) adding bottleneck, and (2) introducing c ...
Authorship
Jiang, Z.
Citation
Jiang, Zhiying (2023) Less is More: Restricted Representations for Better Interpretability and Generalizability, UWSpace - Theses, http://hdl.handle.net/10012/19736
PublicationType
Thesis
Year
2023
185 / 292
Publication 1.0
T-2024-10-30-a1xLpmUjpa30eKX0vMa38ccxQ
Abstract
Climate-driven permafrost degradation and an intensification of the hydrological cycle are rapidly altering the intricate ecohydrological processes of Arctic wetlands, threatening their long-term carbon sequestration capabilities. Addressing this concern through effective management holds immense potential for climate regulation, mitigation, and adaptation efforts. As such, there is growing need for timely spatial inventory data identifying Arctic wetlands with sufficient accuracy, resolution, and detail. Wetland mapping at large scales necessitates the processing of large volumes of Earth observation (EO) data, a challenge known as “Big Data”. Consequently, in this study, we present a cloud-based methodology exploiting the remarkable collection of EO data and computational power of Google Earth Engine (GEE) to map Arctic wetlands at 10 m spatial resolution. Our workflow evaluated temporally aggregated optical and radar satellite imagery and novel hydro-physiographic layers as inputs i ...
Authorship
Merchant Michael, Brisco Brian, Mahdianpari Masoud, Bourgeau-Chavez Laura, Murnaghan Kevin, DeVries Ben, Berg Aaron
Citation
Merchant Michael, Brisco Brian, Mahdianpari Masoud, Bourgeau-Chavez Laura, Murnaghan Kevin, DeVries Ben, Berg Aaron (2023) Leveraging google earth engine cloud computing for large-scale arctic wetland mapping, International Journal of Applied Earth Observation and Geoinformation, Volume 125, 2023, 103589, ISSN 1569-8432
PublicationType
Journal Article
Year
2023
186 / 292
Publication 1.0
T-2022-04-24-p1cSUFc1MKEy3U82ytVmx7A
Abstract
The shoreline of Western Lake Ontario (WLO) comprises ecologically important wetlands and habitats for aquatic life. It is also borders to the Greater Toronto Area (GTA), one of Canada's largest and most densely populated regions. The WLO receives urban stormwater runoff and effluent from treatment plants that deliver nutrients and sediments to the nearshore zone. The WLO is also threatened by invasive species, including dreissenid mussels that are modifying biogeochemical nutrient cycling in the lake. Therefore, the potential re-eutrophication of Lake Ontario remains a major binational concern. In this study, we focus on reconstructing the eutrophication trajectory in WLO to provide essential knowledge to inform mitigation climate-adaptive strategies to protect the lake. We are using chlorophyll-a (Chl-a) concentration data obtained from remote sensing measurements as an indicator of phytoplankton biomass. One particular challenge in the nearshore waters of WLO is the presence of Clad ...
Authorship
Shahvaran Ali Reza, van Cappellen Philippe & Kheyrollah Pour Homa
Citation
Ali Reza Shahvaran, Philippe van Cappellen & Homa Kheyrollah Pour (2022). Long-term monitoring of algal biomass in Western Lake Ontario using remote sensing and in situ data. Proceedings of the GWF Annual Open Science Meeting, May 16-18, 2022.
Project
GWF-Managing Urban Eutrophication Risks under Climate Change: An Integrated Modelling and Decision Support Framework|
PublicationType
Conference Poster
Year
2022
187 / 292
Publication 1.0
T-2024-09-25-71g73ZoWKaV0KFojPrBhrDlg
Abstract
Background and Aims: Stand-replacing crown fires are the most prevalent type of fire regime in boreal forests in North America. However, a substantial proportion of low-severity fires are found within fire perimeters. Here, we aimed to investigate the effects of low-severity fires on the reproductive potential and seedling recruitment in boreal forest stands in between stand-replacing fire events. Methods: We recorded site and tree characteristics from 149 trees within 12 sites dominated by mature black spruce [Picea mariana (Mill.) B.S.P.] trees in the Northwest Territories, Canada. The presence of fire-scarred trees supported classification of sites as unburned or affected by low-severity fires in recent history. We used non-parametric tests to evaluate differences in site conditions between unburned and low-severity sites. We used linear and additive statistical models to evaluate differences in tree age, size and reproductive traits among unburned trees and trees from low-severity ...
Authorship
Alfaro-Sanchez, R., Johnstone, J.F., Baltzer, J.L.
Citation
Alfaro-Sanchez, R., Johnstone, J.F., Baltzer, J.L. (2024) Low-severity fires in the boreal region: reproductive implications for black spruce stands in between stand-replacing fire events, Annals of Botany, https://doi.org/10.1093/aob/mcae055
Project
GWF-NWF: Northern Water Futures|
PublicationType
Journal Article
Year
2024
188 / 292
Publication 1.0
T-2023-02-08-3133QJqfLX4keZ32lDkgxLcAA
Abstract
This study developed an integrated biogeochemical and hydrological modelling system by incorporating the latest versions of the nitrogen coupled Canadian Land Surface Scheme-Canadian Terrestrial Ecosystem Model (CLASS-CTEM) into the Modelisation Environmentale Communautaire (MEC) Surface and Hydrology system (MESH), hereafter referred to as MESH-CTEM. The newly developed MESH-CTEM modelling system allows simulations of energy, water, carbon and nitrogen fluxes and their feedbacks on vegetation growth and exploration of impacts of future climatic changes on catchment-scale processes. Performance of the MESH-CTEM system was tested at the Big Creek watershed within Norfolk county, Ontario, Canada, which is a 573 km2 crop-dominated catchment with areas of broadleaf and needleleaf forests, using observed eddy covariance flux, meteorological and hydrological datasets from October 2004 to December 2017 at a grid resolution of 0.02o latitude × 0.02o longitude. MESH-CTEM showed a significant in ...
Authorship
Sauer, Stefan
Citation
Sauer, Stefan (2019) MESH-CTEM – Development and Testing of an Integrated Biogeochemical and Watershed Hydrological Modelling System http://hdl.handle.net/11375/25018
Project
GWF-SFWF: Southern Forests Water Futures|
PublicationType
Thesis
Year
2019
189 / 292
Publication 1.0
T-2024-12-19-21r218AVWiN0my9CodQleERA
Abstract
Land-atmosphere interactions are commonly quantified using eddy-covariance (EC) equipment. This technique provides fluxes which are attributed to an area-averaged two-dimensional flux footprint. Although source flux heterogeneity is present within these footprints, current EC footprint models are unable to distinguish the variable flux contributions (although they are incorporated into the bulk EC flux). A disaggregation method would increase the value of EC data by allowing users to isolate individual fluxes from features within the flux footprint; furthermore, this may extend the useability of the EC method to more complex terrain of mixed land classifications. It remains unexplored how high-resolution surface energy balance (SEB) models can be used to disaggregate these EC footprints. This thesis presents a SEB workflow using Unoccupied Aerial Vehicles (UAVs) to generate high-resolution patterns of evapotranspiration (ET) to disaggregate EC footprints in a novel disaggregated flux f ...
Authorship
Hunter, Anders
Citation
Hunter, Anders (2022) Mapping evapotranspiration to disaggregate eddy-covariance footprints, USASK Harvest - Theses and Dissertations, https://hdl.handle.net/10388/14378
PublicationType
Thesis
Year
2022
190 / 292
Publication 1.0
T-2024-10-30-Z1sEZ25MHknUeDze2OXzQZ3tA
Abstract
Organic chemical pollutants are delivered to riverine habitats via basin land use and hydrology interactions. Aquatic organisms eventually absorb these substances, where they might have negative consequences. However, our capacity to reliably predict potential future changes in pollutant concentrations is now constrained by information gaps relating to the links between hydrological, chemical, and biological processes. In the South Saskatchewan River, Canada, in the years 2020 and 2021, concentrations of three pesticide classes (organochlorines, organophosphates, and herbicides) in the water, sediments, and fish were examined. Organochlorine pesticides have been prohibited in Canada since the 1970s; however, methoxychlor and lindane were occasionally found in samples of sediment and fish that may have been contaminated in the past. Organophosphate pesticides, with the exception of malathion and parathion, were close to detection limit in both sampling years in all matrices, while neoni ...
Authorship
PRAJAPATI SAURABH
Citation
PRAJAPATI SAURABH (2023) Measuring and modelling concentrations of plant protection products and trace metals in the South Saskatchewan River, USASK Harvest
PublicationType
Thesis
Year
2023
191 / 292
Publication 1.0
T-2025-10-27-01VI023hiclEmLLrxwR6777A
Abstract
Organic chemical pollutants are delivered to riverine habitats via basin land use and hydrology interactions. Aquatic organisms eventually absorb these substances, where they might have negative consequences. However, our capacity to reliably predict potential future changes in pollutant concentrations is now constrained by information gaps relating to the links between hydrological, chemical, and biological processes. In the South Saskatchewan River, Canada, in the years 2020 and 2021, concentrations of three pesticide classes (organochlorines, organophosphates, and herbicides) in the water, sediments, and fish were examined. Organochlorine pesticides have been prohibited in Canada since the 1970s; however, methoxychlor and lindane were occasionally found in samples of sediment and fish that may have been contaminated in the past. Organophosphate pesticides, with the exception of malathion and parathion, were close to detection limit in both sampling years in all matrices, while neoni ...
Authorship
Prajapati, S.
Project
GWF-NGS: Next Generation Solutions for Healthy Water Resources|
PublicationType
Thesis
Year
2023
192 / 292
Publication 1.0
T-2024-01-30-Q1RndbhqpNkOqP4ydwU9gtw
Abstract
Modeling of extreme events is important in many scientific fields, including environmental and civil engineering, and impacts and risk assessments. Among available methods, statistical models that allow estimating extremes’ frequency and intensity are regularly used in procedures to anticipate potential changes in extreme events. Extreme value theory provides a theoretical basis for statistical estimation of extreme events using frequency analysis. The challenge in modeling is knowing when to use the block maxima method or the peaks-over-threshold (POT) method. Each has its drawbacks. POT describes the main characteristics of the observed extreme series; the threshold selection is always challenging and might affect the accuracy of the simulated results and the credibility of changes in extreme values. To encompass this challenge, mixture models offer more flexibility to represent samples with nonhomogeneous data. This study presents the gamma generalized Pareto (GGP) mixture model for ...
Authorship
Yousfi, N., El Adlouni, S., Papalexiou, S. M., Gachon, P.
Citation
Yousfi, N., El Adlouni, S., Papalexiou, S. M., Gachon, P. (2023) Mixture Probability Models with Covariates: Applications in Estimating Risk of Hydroclimatic Extremes. Journal of Hydrologic Engineering, 28(4), 04023011. https://doi.org/10.1061/JHYEFF.HEENG-5831
Project
GWF-Paradigm Shift in Downscaling Climate Model Projections|
PublicationType
Journal Article
Year
2023
193 / 292
Publication 1.0
T-2024-04-03-r1Te5P3YLPUOKcdii1Iy6Tw
Abstract
The effects of wetland management of drainage and restoration on the hydrology of small basins over the Canadian Prairies, were investigated using a virtual basin modelling approach created through the Cold Regions Hydrological Modelling platform (CRHM) for seven biophysical basin classes that typify the region. The model included wind redistribution of snow, energy balance snowmelt, infiltration to frozen soils, Penman-Monteith actual evapotranspiration, soil and ground water dynamics and fill and spill of internally drained surface depressions that often form wetlands. Wetland loss induced by agricultural drainage was represented by scenarios that progressively reduced the depression area and storage capacity by increments of 10%, and ongoing wetland restoration policies were represented by expanding the existing depressions to historical sizes. Model simulations showed that, on average, both annual total streamflow and maximum daily streamflow had the largest sensitivities to wetlan ...
Authorship
He, Z., Shook, K., Spence, C., Pomeroy, J.W., Whitfield, C.
Citation
He, Z., Shook, K., Spence, C., Pomeroy, J.W., Whitfield, C. (2022) Modeling the Streamflow Sensitivity to Wetland Drainage and Restoration Over the Canadian Prairies Using a Basin Classification Approach. American Geophysical Union (AGU) Fall Meeting, Chicago, USA, December 12 to December 16, 2022. https://agu.confex.com/agu/fm22/meetingapp.cgi/Paper/1072974
Project
GWF-PW: Prairie Water|
PublicationType
Conference Poster
Summary
This study investigated the effects of wetland loss caused by agricultural activities on basin streamflow in the Canadian Prairies. At the same time, we studied the extent to which wetland restoration policy could influence streamflow in the Prairies. To do that, we divided the entire Canadian Prairies into seven basin types based on a set of biophysical factors delineating land cover, soil, and topography. Responses of hydrological processes to wetland changes in the classified basins were physically represented in the Cold Regions Hydrological Modelling platform (CRHM). The results quantified the sensitivities of annual total streamflow and peak daily streamflow to per 10% loss or expansion in the wetlands. It is found that restoring wetland closer to the basin outlet is more effective in reducing the volume of peak streamflow. Our results could be used to inform agricultural practices and wetland management policies in the Canadian Prairies where a number of waterfowl and other gras ...
Title
Modeling the Streamflow Sensitivity to Wetland Drainage and Restoration Over the Canadian Prairies Using a Basin Classification Approach
Year
2022
194 / 292
Publication 1.0
T-2022-04-24-o1OraakDgU0yWQE83mlrnTw
Abstract
The Upper Columbia and Okanagan River basins are important mountain headwaters to provide biodiversity and ecosystem services and to supply water for hydropower dams and reservoir operations in British Colombia, Canada, and the northwest United States. However, the impact of forest disturbance by forest harvesting, disease, and wildfire and then recovery, and deglaciation on the basin hydrology has not been thoroughly studied. The impact of largescale forest disturbances in the basin on the magnitude of recent flooding has not been fully investigated. This study aims to develop a methodology to simulate forest disturbance and regrowth in a hydrological land surface model and then use the model to investigate the impact of forest disturbance on the basin hydrology. An enhanced version of MESH (Modélisation Environnementale communautaire - Surface Hydrology) that incorporated mountain hydrology and vector base routing was setup over a total of 2177 model sub-basins; 1822 for the Upper Co ...
Authorship
Tesemma Zelalem, Pomeroy John, Pietroniro Alain
Citation
Zelalem Tesemma, John Pomeroy, Alain Pietroniro (2022). Modelling highly disturbed basins: the Upper Columbia and Okanagan River Basins. Proceedings of the GWF Annual Open Science Meeting, May 16-18, 2022.
Project
GWF-CORE: Core Modelling and Forecasting|
PublicationType
Conference Poster
Year
2022
195 / 292
Publication 1.0
T-2023-10-20-U1IlRrw1zW0WcJaxDPSY6Sg
Abstract
This study evaluated the effects of climate perturbations on snowmelt, soil moisture, and streamflow generation in small Canadian Prairies basins using a modelling approach based on classification of basin biophysical characteristics. Seven basin classes that encompass the entirety of the Prairies Ecozone in Canada were determined by cluster analysis of these characteristics. Individual semi-distributed virtual basin (VB) models representing these classes were parameterized in the Cold Regions Hydrological Model (CRHM) platform, which includes modules for snowmelt and sublimation, soil freezing and thawing, actual evapotranspiration (ET), soil moisture dynamics, groundwater recharge, and depressional storage dynamics including fill and spill runoff generation and variable connected areas. Precipitation (P) and temperature (T) perturbation scenarios covering the range of climate model predictions for the 21st century were used to evaluate climate sensitivity of hydrological processes in ...
Authorship
He, Z., Shook, K., Spence, C., Pomeroy, J. W., Whitfield, C.
Citation
He, Z., Shook, K., Spence, C., Pomeroy, J. W., and Whitfield, C. (2023) Modelling the regional sensitivity of snowmelt, soil moisture, and streamflow generation to climate over the Canadian Prairies using a basin classification approach, Hydrol. Earth Syst. Sci., 27, 3525–3546, https://doi.org/10.5194/hess-27-3525-2023
Project
GWF-PW: Prairie Water|
PublicationType
Journal Article
Title
Modelling the regional sensitivity of snowmelt, soil moisture, and streamflow generation to climate over the Canadian Prairies using a basin classification approach
Year
2023
196 / 292
Publication 1.0
T-2025-05-28-01JrxYGtb5kq6TbdVMRWviw
Abstract
The Modular Assessment of Rainfall–Runoff Models Toolbox (MARRMoT) is a flexible modelling framework reproducing the behaviour of 47 established hydrological models. This toolbox can be used to calibrate and run models in a user-friendly and consistent way and is designed to facilitate the sharing of model code for reproducibility and to support intercomparison between hydrological models. Additionally, it allows users to create or modify models using components of existing ones. We present a new MARRMoT release (v2.1) designed for improved speed and ease of use. While improved computational efficiency was the main driver for this redevelopment, MARRMoT v2.1 also succeeds in drastically reducing the verbosity and repetitiveness of the code, which improves readability and facilitates debugging. The process to create new models or modify existing ones within the toolbox is also simplified in this version, making MARRMoT v2.1 accessible for researchers and practitioners at all levels of e ...
Authorship
Trotter, L., Knoben, W. J. M., Fowler, K. J. A., Saft, M., and Peel, C. P.
Project
GWF-CORE: Core Modelling and Forecasting|
PublicationType
Journal Article
Year
2022
197 / 292
Publication 1.0
T-2022-12-03-Z1SIYIao3HUOUlwXBpJZ2XNA
Abstract
We report on the characteristics of precipitation associated with three types of landfalling atmospheric rivers (ARs) over western North America in the winter season from 1980 to 2004. The ARs are classified according to three landfalling regions as southern, middle and northern types. Two main centers of precipitation are associated with the contributions by the ARs: one over Baja California linked to the southern type of the ARs, and the other over Washington State correlated with the northern and middle types of the ARs. ARs are seen to play a dominant role in the occurrences of extreme precipitation events, with a proportionately greater impact on more extreme events. Moisture flux convergence makes the dominant contribution to precipitation when ARs and extreme precipitation occur simultaneously in the studied areas. Moisture flux convergence in these cases is, in turn, dominated by the mean and transient moisture transported by the transient wind, with greater contribution from t ...
Authorship
Tan, Y., Yang, S., Zwiers, F. Wang, Z., and Sun, Q.
Citation
Tan, Y., Yang, S., Zwiers, F. Wang, Z., and Sun, Q. 2021. Moisture budget analysis of extreme precipitation associated with different types of atmospheric rivers over western North America. Clim Dyn, 58, 793-809, https://doi.org/10.1007/s00382-021-05933-3.
Project
GWF-MWF: Mountain Water Futures|GWF-CPE: Climate-Related Precipitation Extremes|GWF-SDEPFC: Short-Duration Extreme Precipitation in Future Climate|
PublicationType
Journal Article
Year
2021
198 / 292
Publication 1.0
T-2021-11-12-2121acIgAjzUKOHVbw6Z22oOg
Abstract
River ice monitoring is important for hydrological research and water resource management of the Tibetan Plateau but limited by the serious shortage of field observations, and remote sensing can be used as an effective supplementary means for monitoring river ice. However, remote sensing high-altitude river ice is scarce and a basin-scale understanding of river ice is lacking on the Tibetan Plateau. To ascertain the spatial and temporal distribution characteristics of high-altitude river ice at the basin scale, we selected the Babao River basin as the study area, which is a typical river basin located in the northeastern Tibetan Plateau. Utilizing 447 available Landsat images during the river ice period from 1999 to 2018 and the classical normalized difference snow index (NDSI) algorithm, we monitored the river ice in a long time series at the Babao River basin. The average Khat of accuracy validation reached 0.973. The average area of river ice in the river ice period of this basin sh ...
Authorship
Li, H., Li, H., Wang, J., & Hao, X.
Citation
Li, H., Li, H., Wang, J., & Hao, X. (2020). Monitoring high-altitude river ice distribution at the basin scale in the northeastern Tibetan Plateau from a Landsat time-series spanning 1999–2018. Remote Sensing of Environment, 247, 111915, https://doi.org/10.1016/j.rse.2020.111915.
Project
INARCH1: International Network of Alpine Research Catchment Hydrology (Phase 1)|
PublicationType
Journal Article
Year
2020
199 / 292
Publication 1.0
T-2023-02-08-N1hrOiQET60qjN2UlCFxniZw
Abstract
Lake Erie’s commercial and recreational walleye fishery is the largest of the Great Lakes, requiring effective management to maintain a sustainable and complex fishery. Lake Erie’s walleye fishery is composed of multiple spawning populations, which presents a management challenge. The movement patterns and recruitment of distinct walleye populations that make up the fishery must be considered by managers to avoid overexploitation and to maintain population diversity. The Grand River walleye population in Lake Erie’s eastern basin is considered a priority for rehabilitation due to blocked access to spawning habitat by a low-head dam and degraded habitat quality. The objectives of this study were to: i) investigate movement patterns of spawning walleye in the Grand River using acoustic telemetry; and, ii) investigate movement and habitat use of young-of-the-year (YOY) walleye in relation to the Dunnville Dam and surrounding habitat segments using stable isotope analysis. Between 2015 and ...
Authorship
Quinn-Austin, H.
Citation
Quinn-Austin, H. (2020). Movement of mature and early life stages of the Grand River walleye (Sander vitreus) population in Lake Erie's eastern basin http://hdl.handle.net/10012/16257
Project
GWF-LF: Lake Futures|
PublicationType
Thesis
Year
2020
200 / 292
Publication 1.0
T-2022-12-05-X1AHV64lQ4kOJ8svvvEoBRA
Abstract
Unstructured triangular meshes are an efficient and effective landscape representation that are suitable for use in distributed hydrological and land surface models. Their variable spatial resolution provides similar spatial performance to high-resolution structured grids while using only a fraction of the number of elements. Many existing triangulation methods either sacrifice triangle quality to introduce variable resolution or maintain well-formed uniform meshes at the expense of variable triangle resolution. They are also generally constructed to only fulfil topographic constraints. However, distributed hydrological and land surface models require triangles of varying resolution to provide landscape representations that accurately represent the spatial heterogeneity of driving meteorology, physical parameters and process operation in the simulation domain. As such, mesh generators need to constrain the unstructured mesh to not only topography but to other important surface and sub- ...
Authorship
Marsh, C. B., Spiteri, R. J., Pomeroy, J. W., & Wheater, H. S.
Citation
Marsh, C. B., Spiteri, R. J., Pomeroy, J. W., & Wheater, H. S. (2018). Multi-objective unstructured triangular mesh generation for use in hydrological and land surface models. Computers & Geosciences, 119, 49-67. https://doi.org/10.1016/j.cageo.2018.06.009
PublicationType
Journal Article
Year
2018
201 / 292
Publication 1.0
T-2022-12-05-U1TekupC3IkKbu3zGlGwjTA
Abstract
Seasonal measurements of glacier mass balance provide insight into the relation between climate forcing and glacier change. To evaluate the feasibility of using remotely sensed methods to assess seasonal balance, we completed tandem airborne laser scanning (ALS) surveys and field-based glaciological measurements over a 4-year period for six alpine glaciers that lie in the Columbia and Rocky Mountains, near the headwaters of the Columbia River, British Columbia, Canada. We calculated annual geodetic balance using coregistered late summer digital elevation models (DEMs) and distributed estimates of density based on surface classification of ice, snow, and firn surfaces. Winter balance was derived using coregistered late summer and spring DEMs, as well as density measurements from regional snow survey observations and our glaciological measurements. Geodetic summer balance was calculated as the difference between winter and annual balance. Winter mass balance from our glaciological observ ...
Authorship
Pelto, B. M., Menounos, B., & Marshall, S. J.
Citation
Pelto, B. M., Menounos, B., & Marshall, S. J. (2019). Multi-year evaluation of airborne geodetic surveys to estimate seasonal mass balance, Columbia and Rocky Mountains, Canada. Cryosphere, 13(6). https://doi.org/10.5194/tc-13-1709-2019
PublicationType
Journal Article
Year
2019
202 / 292
Publication 1.0
T-2025-09-08-k1gmzSjAAY0OHlfUdHpc5xQ
Abstract
Toxic metals and metalloids pollution is a major ecological and human health issue, yet classical detection methods are limited. Here we review surface-enhanced Raman spectroscopy-based sensors using nanomaterial-based substrates for metal detection, with emphasis on substrate composition, functionalization, and assembly; metal sensing strategies; and analytical performance. Substrates include nobel metals, semiconductors, and composites. Substrate assembly can be done in solution or on solid supports. Sensing strategies comprise direct sensing, reporter recognition, reporter migration, substrate aggregation, and substrate modification. In general, the physicochemical properties of the substrates determine sensor sensitivity through electromagnetic and chemical enhancements of Raman scattering, whereas substrate surface functionalization, or lack thereof, determines sensor selectivity and the sensing mechanism. The main elements analyzed are mercury, lead, copper, arsenic, and chromium ...
Authorship
Yang D., Youden B., Carrier. A, Yu N., Oakes K., Servos .M, Zhang X.
Citation
Yang, D., Youden, B., Carrier, A. et al. (2024) Nanomaterials for surface-enhanced Raman spectroscopy-based metal detection: a review, Environmental Chemistry Letters (Springer) 22, 2425-2465 https://doi.org/10.1007/s10311-024-01758-8
PublicationType
Journal Article
Year
2024
203 / 292
Publication 1.0
T-2024-10-30-910293Y93oz0USpHQtWvUA1Kg
Abstract
We merge classical extreme value methods to extract high (high temperatures (HT)) and low (low temperatures (LT)) temperatures and form time series having at least one extreme value per year. Observed daily maximum and minimum temperature records are used from 4,797 quality-controlled, global, surface stations over 1970–2019. We assess changes in the magnitude and frequency of extreme temperatures by introducing and applying novel methods that exploit the definition of stationarity. Analysis shows significant increasing (40.6% of the stations) and decreasing (41.1%) trends in the frequency of high and LT, respectively, and increasing trends in both high- and low-temperature values (35.6% and 49.7%). Globally, HT and LT frequencies are increasing and decreasing, respectively, by 0.9% and 1.1% per year, relative to the expected frequencies under the assumption of stationarity. The global mean annual HT and LT magnitudes are increasing by 0.004 and 0.016°C/year compared to the expected on ...
Authorship
Nerantzaki, S. D., Papalexiou, S. M., Rajulapati, C. R., Clark, M. P.
Citation
Nerantzaki, S. D., Papalexiou, S. M., Rajulapati, C. R., Clark, M. P. (2023) Nonstationarity in high and low-temperature extremes: Insights from a global observational data set by merging extreme-value methods, Earth's Future, 11, e2023EF003506
PublicationType
Journal Article
Year
2023
204 / 292
Publication 1.0
T-2024-02-27-o14tVpvmwbkSlZbpPo2xvTrA
Abstract
The Global Environmental Multiscale Model (GEM) is currently in operational use for data assimilation and forecasting at 25–15 km scales; regional 10 km scales over North America; and 2.5 km scales over Canada. To evaluate the GEM model for forecasting applications in Iran, global daily temperature and precipitation outputs of GEM at a 25 km scale were compared to data sets from hydrometeorological stations and the De Martonne climate classification method was used to demarcate climate zones for comparisons. GEM model outputs were compared to observations in each of these zones. The results show good agreement between GEM outputs and measured daily temperatures with Kling-Gupta efficiencies of 0.76 for the arid, 0.71 for the semiarid, and 0.78 for the humid regions. There is also an agreement between GEM outputs and measured annual precipitation with differences of 50% for the arid, 36% for the semiarid, and 15% for the humid region. There is a ~13% systematic difference between the el ...
Authorship
Mohammadlou, M., Bahremand, A., Princz, D., Kinar, N., Haghnegahdar, A., Razavi, S.
Citation
Mohammadlou, M., Bahremand, A., Princz, D., Kinar, N., Haghnegahdar, A., Razavi, S. (2022) Objective evaluation of the Global Environmental Multiscale Model (GEM) with precipitation and temperature for Iran. Natural Resource Modeling, 35(3), e12343. https://doi.org/10.1111/nrm.12343
Project
GWF-IMPC: Integrated Modelling Program for Canada|
PublicationType
Journal Article
Year
2022
205 / 292
Publication 1.0
T-2023-02-08-z1DOiXckkz2UmJYsgx07ghyQ
Abstract
Halogenated disinfection by-products (DBPs) are a diverse class of compounds formed during the treatment of drinking water through reactions between natural organic matter (NOM), inorganic precursors such as bromide, and applied disinfectants. Health Canada regulates a handful of DBPs, but there are over 700 unregulated DBPs that have been described and many of these are more toxic than the regulated DBPs. Here, a data-independent precursor isolation and characteristic fragment (DIPC-Frag) method operated on a Q ExactiveTM Hybrid Quadrupole-OrbitrapTM Mass Spectrometer equipped with a UHPLC system was adapted for the detection of brominated and iodinated DBPs (Br-DBPs and I-DBPs) in chlorinated water. Extraction and analytical conditions were optimized, chemometric strategies were applied, and a library of 553 Br-DBPs and 112 I-DBPs was established with structures predicted for the most abundant compounds. As the method exhibited good precision (~15% RSD), it was then used to study tre ...
Authorship
Watts, Christena L.
Citation
Watts, Christena L. (2018). Occurrence and in vitro toxicity of unregulated disinfection by-products in two Saskatchewan drinking water treatment plants http://hdl.handle.net/10388/11499
Project
GWF-OCFM: Developing 'Omic' and Chemical Fingerprinting Methodologies|
PublicationType
Thesis
Year
2018
206 / 292
Publication 1.0
T-2024-10-30-B1Iv03z9e5kaCz35lJJOdJw
Abstract
Machine learning (ML) is increasingly considered the solution to environmental problems where only limited or no physico-chemical process understanding is available. But when there is a need to provide support for high-stake decisions, where the ability to explain possible solutions is key to their acceptability and legitimacy, ML can come short. Here, we develop a method, rooted in formal sensitivity analysis (SA), that can detect the primary controls on the outputs of ML models. Unlike many common methods for explainable artificial intelligence (XAI), this method can account for complex multi-variate distributional properties of the input-output data, commonly observed with environmental systems. We apply this approach to a suite of ML models that are developed to predict various water quality variables in a pilot-scale experimental pit lake. A critical finding is that subtle alterations in the design of an ML model (such as variations in random seed for initialization, functional cl ...
Authorship
Panigrahi Banamali, Razavi Saman, Doig Lorne E., et al.
Citation
Panigrahi Banamali, Razavi Saman, Doig Lorne E., et al. (2024) On Robustness of the Explanatory Power of Machine Learning Models, ESS Open Archive
PublicationType
Journal Article
Year
2024
207 / 292
Publication 1.0
T-2022-12-05-m1IwvsSpPq0eVpC2JZCz5Ag
Abstract
Arctic and subarctic regions are amongst the most susceptible regions on Earth to global warming and climate change. Understanding and predicting the impact of climate change in these regions require a proper process representation of the interactions between climate, carbon cycle, and hydrology in Earth system models. This study focuses on land surface models (LSMs) that represent the lower boundary condition of general circulation models (GCMs) and regional climate models (RCMs), which simulate climate change evolution at the global and regional scales, respectively. LSMs typically utilize a standard soil configuration with a depth of no more than 4 m, whereas for cold, permafrost regions, field experiments show that attention to deep soil profiles is needed to understand and close the water and energy balances, which are tightly coupled through the phase change. To address this gap, we design and run a series of model experiments with a one-dimensional LSM, called CLASS (Canadian La ...
Authorship
Sapriza-Azuri, G., Gamazo, P., Razavi, S., & Wheater, H. S.
Citation
Sapriza-Azuri, G., Gamazo, P., Razavi, S., & Wheater, H. S. (2018). On the appropriate definition of soil profile configuration and initial conditions for land surface-hydrology models in cold regions. Hydrology and Earth System Sciences, 22(6), 3295. https://doi.org/10.5194/hess-22-3295-2018.
PublicationType
Journal Article
Year
2018
208 / 292
Publication 1.0
T-2022-12-05-31mTcgLQs4Euiwpcd8i8QIA
Abstract
Permafrost is an important feature of cold-region hydrology, particularly in river basins such as the Mackenzie River basin (MRB), and it needs to be properly represented in hydrological and land surface models (H-LSMs) built into existing Earth system models (ESMs), especially under the unprecedented climate warming trends that have been observed. Higher rates of warming have been reported in high latitudes compared to the global average, resulting in permafrost thaw with wide-ranging implications for hydrology and feedbacks to climate. The current generation of H-LSMs is being improved to simulate permafrost dynamics by allowing deep soil profiles and incorporating organic soils explicitly. Deeper soil profiles have larger hydraulic and thermal memories that require more effort to initialize. This study aims to devise a robust, yet computationally efficient, initialization and parameterization approach applicable to regions where data are scarce and simulations typically require larg ...
Authorship
Elshamy, M. E., Princz, D., Sapriza-Azuri, G., Abdelhamed, M. S., Pietroniro, A., Wheater, H. S., & Razavi, S.
Citation
Elshamy, M. E., Princz, D., Sapriza-Azuri, G., Abdelhamed, M. S., Pietroniro, A., Wheater, H. S., & Razavi, S. (2020). On the configuration and initialization of a large-scale hydrological land surface model to represent permafrost. Hydrology and Earth System Sciences, 24(1), 349-379. https://doi.org/10.5194/hess-24-349-2020
PublicationType
Journal Article
Summary
Permafrost is an important feature of cold-region hydrology and needs to be properly represented in hydrological and land surface models (H-LSMs), especially under the observed and expected climate warming trends. This study aims to devise a robust, yet computationally efficient, initialization and parameterization approach for permafrost. We used permafrost observations from three sites along the Mackenzie River valley spanning different permafrost classes to test the validity of the approach.
Year
2020
209 / 292
Publication 1.0
T-2024-12-19-Q1KpqoVBQ2TkWzPsW6t2pyjQ1
Abstract
Le réservoir de carbone de sol est un élément clé du cycle global du carbone et donc du système climatique. Les sols et le carbone organique qu'ils contiennent constituent le plus grand réservoir de carbone des écosystèmes terrestres. Ce réservoir est également responsable du stockage d'une grande quantité de carbone prélevé de l'atmosphère par les plantes par la photosynthèse. C'est pourquoi les sols sont considérés comme une stratégie de mitigation viable pour réduire la concentration atmosphérique de CO2 dûe aux émissions globales de CO2 d'origine fossile. Malgré son importance, des incertitudes subsistent quant à la taille du réservoir global de carbone organique de sol et à ses dynamiques. Les modèles de biosphère terrestre sont des outils essentiels pour quantifier et étudier la dynamique du carbone organique de sol. Ces modèles simulent les processus biophysiques et biogéochimiques au sein des écosystèmes et peuvent également simuler le comportement futur du réservoir de carbone ...
Authorship
Gauthier, Charles
Citation
Gauthier, Charles (2023) Optimisation des paramètres de carbone de sol dans le modèle CLASSIC à l'aide d'optimisation bayésienne et d'observations, Umontreal Papyrus - Thèses et mémoires, https://hdl.handle.net/1866/31992
PublicationType
Thesis
Title
Optimisation des paramètres de carbone de sol dans le modèle CLASSIC à l'aide d'optimisation bayésienne et d'observations
Year
2023
210 / 292
Publication 1.0
T-2023-01-04-t10CP83QleE6Qizo8UZ8wGA
Authorship
Dallosch, M. A., & Creed, I. F.
Citation
Dallosch, M. A., & Creed, I. F. (2021). Optimization of Landsat Chl-a Retrieval Algorithms in Freshwater Lakes through Classification of Optical Water Types. Remote Sensing, 13(22), 4607. https://doi.org/10.3390/rs13224607
Project
GWF-LF: Lake Futures|
PublicationType
Journal Article
Title
Optimization of Landsat Chl-a Retrieval Algorithms in Freshwater Lakes through Classification of Optical Water Types
Year
2021
211 / 292
Publication 1.0
T-2024-09-25-w1f2Y8L5Y5UG3tw16h0WECCQ
Authorship
Qu, B., Roy, A., Melton, J.R., Baltzer, J.L., Ryu, Y., Detto, M., Sonnentag, O.
Citation
Qu, B., Roy, A., Melton, J.R., Baltzer, J.L., Ryu, Y., Detto, M., Sonnentag, O. (2024) Optimizing maximum carboxylation rate for North America’s boreal forests in the Canadian Land Surface Scheme Including biogeochemical Cycles (CLASSIC) v.1.3, Geoscientific Model Development
Project
GWF-NWF: Northern Water Futures|
PublicationType
Journal Article
Title
Optimizing maximum carboxylation rate for North America’s boreal forests in the Canadian Land Surface Scheme Including biogeochemical Cycles (CLASSIC) v.1.3
Year
2024
212 / 292
Publication 1.0
T-2024-07-18-B1UT50HCLk0KTnko22UGKB2A
Abstract
Arctic soils store large amounts of organic carbon and other elements, such as amorphous silicon, silicon, calcium, iron, aluminum, and phosphorous. Global warming is projected to be most pronounced in the Arctic, leading to thawing permafrost which, in turn, changes the soil element availability. To project how biogeochemical cycling in Arctic ecosystems will be affected by climate change, there is a need for data on element availability. Here, we analyzed the amorphous silicon (ASi) content as a solid fraction of the soils as well as Mehlich III extractions for the bioavailability of silicon (Si), calcium (Ca), iron (Fe), phosphorus (P), and aluminum (Al) from 574 soil samples from the circumpolar Arctic region. We show large differences in the ASi fraction and in Si, Ca, Fe, Al, and P availability among different lithologies and Arctic regions. We summarize these data in pan-Arctic maps of the ASi fraction and available Si, Ca, Fe, P, and Al concentrations, focusing on the top 100?c ...
Authorship
Stimmler, Peter, Goeckede, Mathias, Elberling, Bo, Natali, Susan, Kuhry, Peter, Perron, Nia, Lacroix, Fabrice, Hugelius, Gustaf, Sonnentag, Oliver, Strauss, Jens, Minions, Christina, Sommer, Michael, Schaller, Jörg
Citation
Stimmler, Peter, Goeckede, Mathias, Elberling, Bo, Natali, Susan, Kuhry, Peter, Perron, Nia, Lacroix, Fabrice, Hugelius, Gustaf, Sonnentag, Oliver, Strauss, Jens, Minions, Christina, Sommer, Michael, Schaller, Jörg (2023) Pan-Arctic soil element bioavailability estimations. Earth Systems Science Data, 15, 1059-1075. https://doi.org/10.5194/essd-15-1059-2023 https://doi.org/10.5194/essd-15-1059-2023 Data https://doi.org/10.17617/3.8KGQUN and https://edmond.mpdl.mpg.de/privateurl.xhtml?token=8cbb0bd8-790f4719-8cd1-a3df4ff99477
Project
GWF-NWF: Northern Water Futures|
PublicationType
Journal Article
Year
2023
213 / 292
Publication 1.0
T-2024-07-18-V1yXRjTafSEKtNbu894RFFA
Abstract
Long-term atmospheric CO2 concentration records have suggested a reduction in the positive effect of warming on high-latitude carbon uptake since the 1990s. A variety of mechanisms have been proposed to explain the reduced net carbon sink of northern ecosystems with increased air temperature, including water stress on vegetation and increased respiration over recent decades. However, the lack of consistent long-term carbon flux and in situ soil moisture data has severely limited our ability to identify the mechanisms responsible for the recent reduced carbon sink strength. In this study, we used a record of nearly 100 site-years of eddy covariance data from 11 continuous permafrost tundra sites distributed across the circumpolar Arctic to test the temperature (expressed as growing degree days, GDD) responses of gross primary production (GPP), net ecosystem exchange (NEE), and ecosystem respiration (ER) at different periods of the summer (early, peak, and late summer) including dominant ...
Authorship
Zona, Donatella, Lafleur, Peter M., Hufkens, Koen, Gioli, Beniamino, Bailey, Barbara, Burba, George, Euskirchen, Eugénie S., Watts, Jennifer D., Arndt, Kyle A., Farina, Mary, Kimball, John S., Heimann, Martin, Göckede, Mathias, Pallandt, Martijn, Christensen, Torben R., Mastepanov, Mikhail, López-Blanco, Efrén, Dolman, Albertus J., Commane, Roisin, Miller, Charles E., Hashemi, Josh, Kutzbach, Lars, Holl, David, Boike, Julia, Wille, Christian, Sachs, Torsten, Kalhori, Aram, Humphreys, Elyn R., Sonnentag, Oliver, Meyer, Gesa, Gosselin, Gabriel H., Marsh, Philip, Oechel, Walter C.
Citation
Zona, Donatella, Lafleur, Peter M., Hufkens, Koen, Gioli, Beniamino, Bailey, Barbara, Burba, George, Euskirchen, Eugénie S., Watts, Jennifer D., Arndt, Kyle A., Farina, Mary, Kimball, John S., Heimann, Martin, Göckede, Mathias, Pallandt, Martijn, Christensen, Torben R., Mastepanov, Mikhail, López-Blanco, Efrén, Dolman, Albertus J., Commane, Roisin, Miller, Charles E., Hashemi, Josh, Kutzbach, Lars, Holl, David, Boike, Julia, Wille, Christian, Sachs, Torsten, Kalhori, Aram, Humphreys, Elyn R., Sonnentag, Oliver, Meyer, Gesa, Gosselin, Gabriel H., Marsh, Philip, Oechel, Walter C. (2023) Panarctic soil moisture control on tundra carbon sequestration and plant productivity. Global Change Biology, 5, 1267-1281. https://doi.org/10.1111/gcb.16487 https://doi.org/10.1111/gcb.16487 The eddy covariance data from RU-Che, RUCok, and GL-ZaH (previously named DKZaH), CA-DL1, were obtained from the European Fluxes Database (http://www.europefluxdata.eu/home), from the Ameriflux Database (http://ameri ...
Project
GWF-NWF: Northern Water Futures|
PublicationType
Journal Article
Year
2023
214 / 292
Publication 1.0
T-2025-10-27-C1WWZg4J1zUyGC1YkxgPC1y8g
Abstract
Le changement climatique modifie rapidement la composition, la structure et le fonctionnement de la forêt boréale. Des simulations robustes de la productivité primaire brute (PPB) de la forêt boréale avec des modèles de biosphère terrestre (MBT) sont essentielles pour prédire la force des sources de puits de carbone dans les régions arctiques-boréales. Les mesures de covariance des turbulences fournissent des données précieuses pour l’analyse et l'affinement des MBT. Dans cette thèse, j'ai organisé un ensemble de données d'analyse de modèles pour les forêts boréales d'Amérique du Nord en compilant et harmonisant les données de flux de covariance des turbulences (les flux de dioxyde de carbone, d'eau et d'énergie) et les mesures environnementales (données météorologiques) sur huit peuplements forestiers matures (> 70 ans) représentatifs des différentes caractéristiques de peuplements, de climat et de conditions de pergélisol du biome boréal. L’ensemble de données a été utilisée dans une ...
Authorship
Qu, B.
Project
GWF-NWF: Northern Water Futures|
PublicationType
Thesis
Year
2024
215 / 292
Publication 1.0
T-2022-12-05-y1dNHAy131bUC5y2iTY9vCKFg
Abstract
Wildfire is the largest disturbance affecting peatlands, with northern peat reserves expected to become more vulnerable to wildfire as climate change enhances the length and severity of the fire season. Recent research suggests that high water table positions after wildfire are critical to limit atmospheric carbon losses and enable the re-establishment of keystone peatland mosses (i.e. Sphagnum). Post-fire recovery of the moss surface in Sphagnum-feathermoss peatlands, however, has been shown to be limited where moss type and burn severity interact to result in a water repellent surface. While in situ measurements of moss water repellency in peatlands have been shown to be greater for feathermoss in both a burned and unburned state in comparison to Sphagnum moss, it is difficult to separate the effect of water content from species. Consequently, we carried out a laboratory based drying experiment where we compared the water repellency of two dominant peatland moss species, Sphagnum and ...
Authorship
Moore, P. A., Lukenbach, M. C., Kettridge, N., Petrone, R. M., Devito, K. J., & Waddington, J. M.
Citation
Moore, P. A., Lukenbach, M. C., Kettridge, N., Petrone, R. M., Devito, K. J., & Waddington, J. M. (2017). Peatland water repellency: Importance of soil water content, moss species, and burn severity. Journal of Hydrology, 554, 656-665. https://doi.org/10.1016/j.jhydrol.2017.09.036
PublicationType
Journal Article
Year
2017
216 / 292
Publication 1.0
T-2025-09-28-J1tUFuLJ1vTUuYfCwXoeAMTA
Abstract
The genus Pseudomonas includes genetically diverse groups of species that do not share a common evolutionary history. My research focused on analyzing the genome sequences of different Pseudomonas species to robustly elucidate their evolutionary relationships using multiple independent approaches, which include: (i) Construction of phylogenetic trees based on several large data sets of conserved proteins, and 16S rRNA gene sequences (ii) Determination of pairwise genomic similarities based on AAI and POCP matrices, (iii) Identification of molecular markers such as Conserved Signature Indels (CSIs) and Conserved Signature Proteins (CSPs), specific for different Pseudomonas species clades supported by other methods. Our Phylogenomic analyses revealed three major lineages/groups within Pseudomonas: Aeruginosa, Fluorescens, and Pertucinogena. While the Aeruginosa and Fluorescens lineages include multiple distinct clades, no molecular or biochemical traits were previously known to different ...
Authorship
Rudra, B.
Citation
Rudra, B. (2025) Phylogenomic and molecular signature-based approaches for resolving the evolutionary relationships among pseudomonas species, MacSphere, Open Access Dissertations and Theses Community, Open Access Dissertations and Theses, https://hdl.handle.net/11375/31820
Project
GWF-Artificial Intelligence for Rapid and Reliable Detection of Cryptosporidium oocysts and Giardia cysts|
PublicationType
Thesis
Year
2025
217 / 292
Publication 1.0
T-2024-07-10-U1B3QU2o8GykC9u3rxduXM9A
Abstract
The availability and quality of quad-pol synthetic aperture radar (SAR) datasets has increased substantially since the early 2000s, allowing for polarimetrically complete investigations of freshwater ice. These investigations have lead to improved ice classification methods, new understanding of microwave-ice scattering processes, and the potential for new methods to extract ice observables. Such analyses are predicated on the decomposition of the target’s polarimetric properties along mathematical or physical lines. This paper comprehensively reviews the underlying theory and contemporary application of radar polarimetric decomposition as it applies to freshwater ice systems. Modelling and investigation of lake ice, river ice, and glacial systems are discussed. We conclude with recommendations for further research, discussing the value of further development of freshwater-ice models, their use in characterization of the scattering process, and the potential for new methods to extract ...
Authorship
Ferguson, J. E., Gunn, G. E.
Citation
Ferguson, J. E., Gunn, G. E. (2022) Polarimetric decomposition of microwave-band freshwater ice SAR data: Review, analysis, and future directions. Remote Sensing of Environment, 280, 113176. https://doi.org/10.1016/j.rse.2022.113176
Project
GWF-Remotely Sensed Monitoring of Northern Lake Ice Using RADARSAT Constellation Mission and Cloud Computing|
PublicationType
Journal Article
Year
2022
218 / 292
Publication 1.0
T-2025-09-08-K3K1LQWwl4HU6lZziPjK1gGgw
Abstract
Conifer forests historically have been resilient to wildfires in part due to thick organic soil layers that regulate combustion and post-fire moisture and vegetation change. However, recent shifts in fire activity in western North America may be overwhelming these resilience mechanisms with potential impacts for energy and carbon exchange. Here, we quantify the long-term recovery of the organic soil layer and its carbon pools across 511 forested plots. Our plots span ~ 140,000 km2 across two ecozones of the Northwest Territories, Canada, and allowed us to investigate the impacts of time-after-fire, site moisture class, and dominant canopy type on soil organic layer thickness and associated carbon stocks. Despite thinner soil organic layers in xeric plots immediately after fire, these drier stands supported faster post-fire recovery of the soil organic layer than in mesic plots. Unlike xeric or mesic stands, post-fire soil carbon accumulation rates in hydric plots were negligible despit ...
Authorship
Bill K. E., Dieleman C. M., Baltzer J. L., Degré-Timmons G. É., Mack M. C., Day N. J., Cumming S. G., Walker X. J., Turetsky M. R.
Citation
Bill K. E., Dieleman C. M., Baltzer J. L. et al. (2023) Post-fire Recovery of Soil Organic Layer Carbon in Canadian Boreal Forests, Ecosystems (Springer) 26(8):1623-1639 https://doi.org/10.1007/s10021-023-00854-0
PublicationType
Journal Article
Year
2023
219 / 292
Publication 1.0
T-2022-12-05-Y1vetgY3NOck6GNlE9Y3lDLGg
Abstract
Although there is increasing consensus that river restoration should focus on restoring processes rather than form, proven techniques to design and monitor projects for sediment transport processes are lacking. This study monitors bedload transport and channel morphology in a rural, an urban unrestored, and an urban restored reach. Objectives are to compare bedload transport regimes, assess the stability and self-maintenance of constructed riffle-pool sequences, and evaluate the impact of the project on coarse sediment continuity in the creek. Sediment tracking is done using radio frequency identification tracers and morphologic change is assessed from repeated cross-section surveys. Mean annual velocity is used to quantify the average downstream velocity of tracers, defined as the mean overall tracer travel length divided by the total study duration. The channel reconstruction slows down the downstream velocity of particles in the D75 and D90 size classes, but does not significantly c ...
Authorship
Papangelakis, E., & MacVicar, B.
Citation
Papangelakis, E., & MacVicar, B. (2020). Process-based assessment of success and failure in a constructed riffle-pool river restoration project. River Research and Applications. https://doi.org/10.1002/rra.3636
PublicationType
Journal Article
Year
2020
220 / 292
Publication 1.0
T-2023-02-08-K1MYwx9I7sEW4vS3YI5pPEw
Abstract
Cyanobacteria, also known as blue-green algae for a long time, are the most ancient and problematic bloom-forming phylum on earth. An alert levels framework has been established by World Health Organization(WHO) to prevent the potential harmful cyanobacterial blooms. Normally, low cyanobacteria levels are found in surface water. 2000 cyanobacterial cells/mL and 100,000 cyanobacterial cells/mL are established for WHO Alert Level 1 and 2, respectively. However, eutrophication, climate change and other factors may promote the spread of cyanobacteria and increase the occurrence of harmful cyanobacterial blooms in water on a global scale. Hence, a rapid real time cyanobacteiral monitoring system is required to protect public health from the cyanotoxins produced by toxic cyanobacterial species. Current methods to control or prevent the development of harmful cyanobacterial blooms are either expensive, time consuming or not effective in the long term. The best method to control the blooms is t ...
Authorship
Zhang, Yushan
Citation
Zhang, Yushan (2021). Quantification of Low-Level Cyanobacteria Using A Microflow Cytometry Platform for Early Warning of Potential Cyanobacterial Blooms http://hdl.handle.net/11375/27037
Project
GWF-Artificial Intelligence for Rapid and Reliable Detection of Cryptosporidium oocysts and Giardia cysts|
PublicationType
Thesis
Year
2021
221 / 292
Publication 1.0
T-2024-12-19-l1bp7nYWdNkSqCHiVUszoaQ
Abstract
In seasonally frozen environments, hydrological processes are highly dynamic during and following the melt period in the spring, and this is when most of the runoff and groundwater re- charge happens. This is also when evapotranspiration (ET) fluxes start to increase in response to higher solar radiation, and a resumption of photosynthesis in evergreen species. This thesis applies the Canadian Land Surface Scheme (CLASS) to three Boreal Ecosystem Research and Monitoring Sites (BERMS) in the boreal forest in Saskatchewan; Old Jack Pine, Old Black Spruce and Old Aspen. CLASS was used to simulate the energy and water balance of the vegetation, soil and snowpack at the three sites. Consistent with previous studies, it was shown that ET is overestimated in the model during the melt/thaw period. A series of numerical experiments were undertaken to investigate in detail the controls on simulated fluxes within the CLASS model and explore the model behaviour. The phenomenon of freezing point de ...
Authorship
Basnet, Sujan
Citation
Basnet, Sujan (2022) Quantifying Evapotranspiration in Seasonally Frozen Forests, USASK Harvest - Theses and Dissertations, https://hdl.handle.net/10388/13773
PublicationType
Thesis
Year
2022
222 / 292
Publication 1.0
T-2022-04-24-J1ltJ1VyGOG0uKJ3chsvJ1ekEg
Abstract
Major rivers that originate in mountainous areas provide the main water supply for more than one third of the world's population. These rivers typically exhibit a four-to-five-month high flow period driven by snowmelt and rain, followed by a seven-to-eight-month low flow period sustained by groundwater discharge from mountain headwaters. Recent small-scale and field-based studies have identified talus slopes, moraines, rock glaciers, and alpine meadows as the main landforms responsible for storing and discharging groundwater in these headwater environments and have further classified them as alpine aquifers. However, there has not been much progress upscaling our current small-scale understanding of alpine aquifers to the watershed-scale. This study aims to upscale our knowledge of alpine aquifers by developing a geospatial modelling approach that can 1) map the spatial extent and distribution of different aquifers that are common in alpine watersheds and 2) employ a numerical groundwa ...
Authorship
Ralph Brayden, Hayashi Masaki
Citation
Brayden Ralph, Masaki Hayashi (2022). Quantifying Groundwater Storage and Discharge in Alpine Environments. Proceedings of the GWF Annual Open Science Meeting, May 16-18, 2022.
Project
GWF-MWF: Mountain Water Futures|
PublicationType
Conference Poster
Year
2022
223 / 292
Publication 1.0
T-2022-12-05-l1uhEYmbqtUml20kgohyHP3Q
Abstract
The role of hummocky terrain in governing runoff routing and focussing groundwater recharge in the Northern Prairies of North America is widely recognised. However, most hydrological studies in the region have not effectively utilised information on the surficial geology and associated landforms in large-scale hydrological characterization. The present study uses an automated digital elevation model (DEM) analysis of a 6500-km2 area in the Northern Prairies to quantify hydrologically relevant terrain parameters for the common types of terrains in the prairies with different surficial deposits widespread in the prairies, namely, moraines and glaciolacustrine deposits. Runoff retention (and storage) capacity within depressions varies greatly between different surficial deposits and is comparable in magnitude with a typical amount of seasonal snowmelt runoff generation. The terrain constraint on potential runoff retention varies from a few millimetres in areas classified as moraine to ten ...
Authorship
Pavlovskii, I., Noorduijn, S. L., Liggett, J. E., Klassen, J., & Hayashi, M.
Citation
Pavlovskii, I., Noorduijn, S. L., Liggett, J. E., Klassen, J., & Hayashi, M. (2020). Quantifying terrain controls on runoff retention and routing in the Northern Prairies. Hydrological Processes, 34(2), 473-484. https://doi.org/10.1002/hyp.13599
PublicationType
Journal Article
Year
2020
224 / 292
Publication 1.0
T-2022-12-05-U1kcEuBY8P0apWyLy5f7Paw
Abstract
Identical or nearly similar code fragments in a software system's code-base are known as code clones. Code clones from the same clone class have a tendency of co-changing (changing together) consistently during evolution. Focusing on this co-change tendency, existing studies have investigated prediction and ranking co-change candidates of regular clones. However, a recent study shows that micro-clones which are smaller than the minimum size threshold of regular clones might also need to be co-changed consistently during evolution. Thus, identifying and ranking co-change candidates of micro-clones is also important. In this paper, we investigate factors that influenc the co-change tendency of the co-change candidates of a target micro-clone fragment.
We mine fil level evolutionary coupling from thousands of revisions of our subject systems through mining association rules and analyze this coupling for the purpose of ranking. According to our finding on six open-source subject systems w ...
Authorship
Mondal, M., Roy, B., Roy, C. K., & Schneider, K. A.
Citation
Mondal, M., Roy, B., Roy, C. K., & Schneider, K. A. (2019d). Ranking co-change candidates of micro-clones. In Proceedings of the 29th Annual International Conference on Computer Science and Software Engineering (pp. 244-253). https://dl.acm.org/doi/abs/10.5555/3370272.3370298
PublicationType
Journal Article
Year
2019
225 / 292
Publication 1.0
T-2022-12-03-r1eLxYqiesUO8zGYpKU4cEg
Abstract
As a consequence of increasing temperatures, a rapid increase in shrub vegetation has occurred throughout the circumpolar North and is expected to continue. Rates of shrub expansion are highly variable, both at the regional scale and within local study areas. This study uses repeat airborne LiDAR and field surveys to measure changes in shrub vegetation cover along with landscape-scale variations in a well-studied subarctic headwater catchment in Yukon Territory, Canada. Airborne LiDAR surveys were conducted in August 2007 and 2018, whereas vegetation surveys were conducted in summer 2019. Machine learning classification algorithms were used to predict shrub presence/absence in 2018 based on rasterized LiDAR metrics, with the best-performing model applied to the 2007 LiDAR to create binary shrub cover layers to compare between survey years. Results show a 63.3% total increase in detectable shrub cover >= 0.45 m in height between 2007 and 2018, with an average yearly expansion of 5.8%. T ...
Authorship
Leipe, S.C., and Carey, S.K.
Citation
Leipe, S.C., and Carey, S.K. 2021. Rapid shrub expansion in a subarctic mountain basin revealed by repeat airborne LiDAR. Environmental Research Communications, 3 071001, https://doi.org/10.1088/2515-7620/ac0e0c.
Project
GWF-MWF: Mountain Water Futures|
PublicationType
Journal Article
Year
2021
226 / 292
Publication 1.0
T-2024-01-29-d13Yd1YJWRQEewotK6wVEHJA
Abstract
The real-time polymerase chain reaction (PCR), commonly known as quantitative PCR (qPCR), is increasingly common in environmental microbiology applications. During the COVID-19 pandemic, qPCR combined with reverse transcription (RT-qPCR) has been used to detect and quantify SARS-CoV-2 in clinical diagnoses and wastewater monitoring of local trends. Estimation of concentrations using qPCR often features a log-linear standard curve model calibrating quantification cycle (Cq) values obtained from underlying fluorescence measurements to standard concentrations. This process works well at high concentrations within a linear dynamic range but has diminishing reliability at low concentrations because it cannot explain “non-standard” data such as Cq values reflecting increasing variability at low concentrations or non-detects that do not yield Cq values at all. Here, fundamental probabilistic modeling concepts from classical quantitative microbiology were integrated into standard curve modelin ...
Authorship
Schmidt, P.J., Acosta, N., Chik, A.H.S., D'Aoust, P.M., Delatolla, R., Dhiyebi, H.A., et al.
Citation
Schmidt, P.J., Acosta, N., Chik, A.H.S., D'Aoust, P.M., Delatolla, R., Dhiyebi, H.A., et al. (2023). Realizing the value in “non-standard” parts of the qPCR standard curve by integrating fundamentals of quantitative microbiology. Front Microbiol. 2023 Mar 3. https://www.frontiersin.org/articles/10.3389/fmicb.2023.1048661/full
Project
GWF-WSPT: Winter Soil Processes in Transition|
PublicationType
Journal Article
Year
2023
227 / 292
Publication 1.0
T-2022-12-05-N3N1axjtvC8U6csh06YMeLyA
Abstract
Developers often search for relevant code examples on the web for their programming tasks. Unfortunately, they face two major problems. First, the search is impaired due to a lexical gap between their query (task description) and the information associated with the solution. Second, the retrieved solution may not be comprehensive, i.e., the code segment might miss a succinct explanation. These problems make the developers browse dozens of documents in order to synthesize an appropriate solution. To address these two problems, we propose CROKAGE (Crowd Knowledge Answer Generator), a tool that takes the description of a programming task (the query) and provides a comprehensive solution for the task. Our solutions contain not only relevant code examples but also their succinct explanations. Our proposed approach expands the task description with relevant API classes from Stack Overflow Q&A threads and then mitigates the lexical gap problems. Furthermore, we perform natural language proces ...
Authorship
Silva, R., Roy, C., Rahman, M., Schneider, K., Paixao, K., & Maia, M.
Citation
Silva, R., Roy, C., Rahman, M., Schneider, K., Paixao, K., & Maia, M. (2019). Recommending comprehensive solutions for programming tasks by mining crowd knowledge. In 2019 IEEE/ACM 27th International Conference on Program Comprehension (ICPC) (pp. 358-368). IEEE. https://doi.org/10.1109/ICPC.2019.00054
PublicationType
Journal Article
Year
2019
228 / 292
Publication 1.0
T-2022-12-05-81Ea81nvtsrkuXMrfy81M83daA
Abstract
Quantifying the behavior and performance of hydrologic models is an important aspect of understanding the underlying hydrologic systems. We argue that classical error measures do not offer a complete picture for building this understanding. This study demonstrates how the information theoretic measure known as transfer entropy can be used to quantify the active transfer of information between hydrologic processes at various timescales and facilitate further understanding of the behavior of these systems. To build a better understanding of the differences in dynamics, we compare model instances of the Structure for Unifying Multiple Modeling Alternatives (SUMMA), the Variable Infiltration Capacity (VIC) model, and the Precipitation Runoff Modeling System (PRMS) across a variety of hydrologic regimes in the Columbia River Basin in the Pacific Northwest of North America. Our results show differences in the runoff of the SUMMA instance compared to the other two models in several of our stu ...
Authorship
Bennett, A., Nijssen, B., Ou, G., Clark, M., & Nearing, G.
Citation
Bennett, A., Nijssen, B., Ou, G., Clark, M., & Nearing, G. (2019). Quantifying process connectivity with transfer entropy in hydrologic models. Water Resources Research, 55(6), 4613-4629. https://doi.org/10.1029/2018WR024555.
PublicationType
Journal Article
Year
2019
229 / 292
Publication 1.0
T-2023-01-04-Z1giVIZ2c1v0OpovbfZ2AA9Mg
Abstract
Assessing extreme precipitation events is of high importance to hydrological risk assessment, decision making, and adaptation strategies. Global gridded precipitation products, constructed by combining various data sources such as precipitation gauge observations, atmospheric reanalyses and satellite estimates, can be used to estimate extreme precipitation events. Although these global precipitation products are widely used, there has been limited work to examine how well these products represent the magnitude and frequency of extreme precipitation. In this work, the five most widely used global precipitation datasets (MSWEP, CFSR, CPC, PERSIANN-CDR and WFDEI) are compared to each other and to GHCN-daily surface observations. The spatial variability of extreme precipitation events and the discrepancy amongst datasets in predicting precipitation return levels (such as 100- and 1000-year) were evaluated for the time period 1979-2017. The behaviour of extremes, that is the frequency and ...
Authorship
Rajulapati, C.R., Papalexiou, S.M., Clark, M.P., Razavi, S., Tang, G., Pomeroy, J.
Citation
Rajulapati, C.R., Papalexiou, S.M., Clark, M.P., Razavi, S., Tang, G., Pomeroy, J., 2021b. Reliability of global gridded precipitation products in assessing extremes. EGU21, Copernicus Meetings. https://doi.org/10.5194/egusphere-egu21-3246?
PublicationType
Conference Presentation
Year
2021
230 / 292
Publication 1.0
T-2022-12-03-B1dG03rB1OhEK1g1q352isaw
Abstract
Software developers often look for solutions to their code-level problems by submitting questions to technical Q&A websites like Stack Overflow (SO). They usually include example code segments with questions to describe the programming issues. SO users prefer to reproduce the reported issues using the given code segments when they attempt to answer the questions. Unfortunately, such code segments could not always reproduce the issues due to several unmet challenges (e.g., external library not found) that might prevent questions from receiving prompt and appropriate solutions. A previous study produced a catalog of potential challenges that hinder the reproducibility of issues reported at SO questions. However, it is unknown how the practitioners (i.e., developers) perceive the challenge catalog. Understanding the developers' perspective is inevitable to introduce interactive tool support that promotes reproducibility. We thus attempt to understand developers' perspectives by surveying ...
Authorship
Mondal, S., and Roy, B.
Citation
Mondal, S., and Roy, B. (2022) Reproducibility Challenges and Their Impacts on Technical Q&A Websites: The Practitioners' Perspectives, ACM 15th Innovation in Software Engineering Conference (ISEC 2022), Article 11, pp. 1-11. https://doi.org/10.1145/3511430.3511439
Project
GWF-CS: Computer Science|
PublicationType
Journal Article
Year
2022
231 / 292
Publication 1.0
T-2024-12-19-c1j4llmID8k2jD0B8xl7U0w
Abstract
Hydrological models, which have become increasingly complex in the last half century due to the advances in computing capabilities and data collection, have been extensively utilized to facilitate decision-making in water resources management. Such computer-based models generally contain considerable parameters that cannot be directly measured, and hence calibration and validation are required to ensure model transferability and robustness in model building (development). The most widely used method used for assessing model transferability in time is the split-sample test (SST) framework, which has even been a paradigm in the hydrological modeling community for decades. However, there is no clear guidance or empirical/numerical evidence that supports how a dataset should be split into the calibration and validation subsets. The SST decisions usually appear to be unclear and even subjective in literature. Even though past studies have spared tremendous efforts to investigate possible wa ...
Authorship
Shen, Hongren
Citation
Shen, Hongren (2023) Rethinking the Split-Sample Approach in Hydrological Model Calibration, UWSpace - Theses, http://hdl.handle.net/10012/20038
PublicationType
Thesis
Year
2023
232 / 292
Publication 1.0
T-2022-11-22-01TA9FCMhi01Oj02mFHtZqTuQ
Abstract
Both climate and statistical models play an essential role in the process of demonstrating that the distribution of some atmospheric variable has changed over time and in establishing the most likely causes for the detected change. One statistical difficulty in the research field of detection and attribution resides in defining events that can be easily compared and accurately inferred from reasonable sample sizes. As many impacts studies focus on extreme events, the inference of small probabilities and the computation of their associated uncertainties quickly become challenging. In the particular context of event attribution, the authors address the question of how to compare records between the counterfactual “world as it might have been” without anthropogenic forcings and the factual “world that is.” Records are often the most important events in terms of impact and get much media attention. The authors will show how to efficiently estimate the ratio of two small probabilities of re ...
Authorship
Naveau, P., A. Ribes, F.W. Zwiers, A. Hannart, A. Tuel, P. Yiou.
Citation
Naveau, P., Ribes, A., Zwiers, F., Hannart, A., Tuel, A., & Yiou, P. (2018). Revising Return Periods for Record Events in a Climate Event Attribution Context, Journal of Climate, 31(9), 3411-3422. Retrieved Nov 22, 2022, from https://journals.ametsoc.org/view/journals/clim/31/9/jcli-d-16-0752.1.xml
PublicationType
Journal Article
Year
2018
233 / 292
Publication 1.0
T-2024-10-30-u19bcKhhN2EKNP880SPnBrQ
Abstract
This book exposes practitioners and students to the theory and application of river and lake ice processes to gain a better understanding of these processes for modelling and forecasting. It focuses on the following processes of the surface water ice: freeze-up, ice cover thickening, ice cover breakup and ice jamming. The reader will receive a fundamental understanding of the physical processes of each component and how they are applied in monitoring and modelling ice covers during the winter season and forecasting ice floods. Exercises accompany each component to reinforce the theoretical principles learned. These exercises will also expose the reader to different tools to process data, such a space-borne remote sensing imagery for ice cover classification. A thread supporting numerical modelling of river ice and lake ice processes runs through the book.
Authorship
Karl-Erich Lindenschmidt
Citation
Karl-Erich Lindenschmidt (2023) River Ice Processes and Ice Flood Forecasting, Springer Cham
PublicationType
Book
Year
2023
234 / 292
Publication 1.0
T-2025-06-23-e2e1kfMFrT0EOsDJZRY0ljvA
Abstract
The nc file contains two global Köppen-Geiger (KG) Climate Classification maps (resolution 0.5°).
The robust maps are developed by using monthly temperature and precipitation data from UDEL, CRU, JRA55, NCEP/CFSR, MERRA2, ERA5, and WFDEI gridded products over the period 1980 to 2017.
MasterMap 1 shows the most frequently observed climate types among all KG maps for each grid point, after directly merging the climate maps produced by the seven datasets.
MasterMap 2 results from estimating the medians of precipitation and temperature among the seven datasets at each grid point.
Authorship
Hobbi, S., Papalexiou, M. S., Rajulapati, C., Rajulapati, C., Nerantzaki, S. D., Markonis Y., Tang, G., Clark, M.
Citation
Hobbi, Salma; Papalexiou, Simon Michael; Rajulapati, Chandra; Nerantzaki, Sofia D.; Markonis, Yannis; Tang, Guoqiang; Clark, Martyn (2022), “Robust Köppen-Geiger (KG) Climate Classification Maps”, Mendeley Data, V1, doi: 10.17632/6f7nrdnyrx.1
Project
GWF-Paradigm Shift in Downscaling Climate Model Projections|
PublicationType
New Value
Title
Robust Köppen-Geiger (KG) Climate Classification Maps
Year
2022
235 / 292
Publication 1.0
T-2023-01-19-s1iyPr1cflUeM5bVUWys3aDg
Authorship
Aksamit, N. O., & Pomeroy, J. W.
Citation
Aksamit, N. O., & Pomeroy, J. W. (2015). Saltating snow mechanics: Three species classification from high speed videography. Proceedings of the 72nd Eastern Snow Conference, 56-66. http://www.usask.ca/hydrology/papers/Aksamit_Pomeroy_2015.pdf
PublicationType
Journal Article
Title
Saltating snow mechanics: Three species classification from high speed videography
Year
2015
236 / 292
Publication 1.0
T-2025-10-14-u1Bu1wMu2gMxU6mMVlXrKa9BQ
Abstract
We present a novel method for surface freeze/thaw (F/T) classification based on L-band brightness temperature (TB), as measured by the Soil Moisture Active Passive (SMAP) mission, combined with thermodynamic temperature estimates, whether in situ or derived from near real-time model output. Variations in the cryosphere have significant, lasting impacts on physical, biological, and social systems, and act as sensitive indicators of climate change. Remote sensing at microwave frequencies is uniquely suited for monitoring the cryosphere’s spatial and temporal dynamics. Indeed, SMAP was tasked with providing a daily classification of the surface F/T state as one of two primary mission goals. Although surface F/T events are extrinsically driven phenomena, most existing classification algorithms rely on intrinsic thresholds – those derived from single-variable observables – that may not accurately reflect in situ conditions. Meanwhile, soil physicists have long used a robust framework to stu ...
Authorship
Pardo Lara, R., Colliander, A., Tetlock, E., Powers, J., Ambadan, J. T., and Berg, A.
Project
GWF-TSTSW: Transformative Sensor Technologies and Smart Watersheds|
PublicationType
Journal Article
Year
2025
237 / 292
Publication 1.0
T-2021-11-14-J1HvJ2I96Lh0uFLfMirICPQQ
Abstract
first_pagesettingsOrder Article Reprints
Open AccessArticle
Satellite-Observed Soil Moisture as an Indicator of Wildfire Risk
by Jaison Thomas Ambadan,Matilda Oja,Ze’ev GedalofORCID andAaron A. Berg *ORCID
Department of Geography, Environment and Geomatics, University of Guelph, Guelph, ON N1G 2W1, Canada
*
Author to whom correspondence should be addressed.
Remote Sens. 2020, 12(10), 1543; https://doi.org/10.3390/rs12101543
Received: 20 February 2020 / Revised: 6 May 2020 / Accepted: 7 May 2020 / Published: 12 May 2020
(This article belongs to the Section Remote Sensing in Agriculture and Vegetation)
Download Browse Figures Versions Notes
Abstract
Wildfires are a concerning issue in Canada due to their immediate impact on people’s lives, local economy, climate, and environment. Studies have shown that the number of wildfires and affected areas in Canada has increased during recent decades and is a result of a warming and drying climate. Therefore, identifying potential wildfire risk ar ...
Authorship
Thomas Ambadan, J., Oja, M., Gedalof, Z., & Berg, A. A.
Citation
Thomas Ambadan, J., Oja, M., Gedalof, Z., & Berg, A. A. (2020). Satellite-Observed Soil Moisture as an Indicator of Wildfire Risk, Remote Sensing 12, 1543, https://dx.doi.org/10.3390/rs12101543
Project
GWF-NWF: Northern Water Futures|
PublicationType
Journal Article
Year
2020
238 / 292
Publication 1.0
T-2024-12-19-V18Mg640CIUe7XXxcp2t6bw
Abstract
Recent advancements in language models, particularly for high-resource languages, have not been paralleled in low-resource languages spoken across Africa. This thesis addresses this gap by scaling pre-training data and developing improved language models for African languages. We introduce Wura, a high-quality, document-level pre-training dataset encompassing 16 African languages along with four high-resource languages commonly spoken on the continent: Arabic, English, French, and Portuguese. Leveraging Wura, we pre-train new versions of the AfriBERTa (encoder-only) and AfriTeVa (encoder-decoder) model families. These new models demonstrate superior performance across a variety of natural language understanding and generation tasks compared to existing baselines. Notably, AfriTeVa V2 Large (1B) stands as the largest sequence-to-sequence model pre-trained for African languages to date. Our methodology includes a meticulous three-stage curation process for Wura --- auditing and filterin ...
Authorship
Oladipo, Akintunde
Citation
Oladipo, Akintunde (2024) Scaling pre-training data & language models for african languages, UWSpace - Theses, https://hdl.handle.net/10012/20872
PublicationType
Thesis
Year
2024
239 / 292
Publication 1.0
T-2022-12-05-41BNe5o7veUCCZ66db0tgHw
Abstract
Lake ice is a significant component of the cryosphere due to its large spatial coverage in high-latitude regions during the winter months. The Laurentian Great Lakes are the world’s largest supply of freshwater and their ice cover has a major impact on regional weather and climate, ship navigation, and public safety. Ice experts at the Canadian Ice Service (CIS) have been manually producing operational Great Lakes image analysis charts based on visual interpretation of the synthetic aperture radar (SAR) images. In that regard, we have investigated the performance of the semi-automated segmentation algorithm “glocal” Iterative Region Growing with Semantics (IRGS) for lake ice classification using dual polarized RADARSAT-2 imagery acquired over Lake Erie. Analysis of various case studies indicated that the “glocal” IRGS algorithm could provide a reliable ice-water classification using dual polarized images with a high overall accuracy of 90.4%. However, lake ice types that are based on s ...
Authorship
Parisien, M. A., Robinne, F. N., Perez, J. Y., Denave, B., DeLancey, E. R., & Doche, C.
Citation
Parisien, M. A., Robinne, F. N., Perez, J. Y., Denave, B., DeLancey, E. R., & Doche, C. (2018). Scénarios de probabilité et puissance potentielle des feux de végétation dans le département des Landes, France. Canadian Journal of Forest Research, 48(12), 1587-1600. https://doi.org/10.1139/cjfr-2018-0223
PublicationType
Journal Article
Year
2018
240 / 292
Publication 1.0
T-2021-11-14-k1Z4k1C4vM5EeZDiXavTCPk3w
Abstract
Climate extremes such as heat waves and droughts are projected to occur more frequently with increasing temperature and an intensified hydrological cycle. It is important to understand and quantify how forest carbon fluxes respond to heat and drought stress. In this study, we developed a series of daily indices of sensitivity to heat and drought stress as indicated by air temperature (Ta ) and evaporative fraction (EF). Using normalized daily carbon fluxes from the FLUXNET Network for 34 forest sites in North America, the seasonal pattern of sensitivities of net ecosystem productivity (NEP), gross ecosystem productivity (GEP) and ecosystem respiration (RE) in response to Ta and EF anomalies were compared for different forest types. The results showed that warm temperatures in spring had a positive effect on NEP in conifer forests but a negative impact in deciduous forests. GEP in conifer forests increased with higher temperature anomalies in spring but decreased in summer. The drought- ...
Authorship
Xu, B., Arain, M. A., Black, T. A., Law, B. E., Pastorello, G. Z., & Chu, H.
Citation
Xu, B., Arain, M. A., Black, T. A., Law, B. E., Pastorello, G. Z., & Chu, H. (2020). Seasonal variability of forest sensitivity to heat and drought stresses: a synthesis based on carbon fluxes from North American forest ecosystems. Global change biology, 26(2), 901-918. https://doi.org/10.1111/gcb.14843
Project
GWF-SFWF: Southern Forests Water Futures|
PublicationType
Journal Article
Year
2020
241 / 292
Publication 1.0
T-2023-11-06-Y1xmFD5uAUEylQKk6sY3o8eQ
Abstract
Software architectural changes involve more than one module or component and are complex to analyze compared to local code changes. Development teams aiming to review architectural aspects (design) of a change commit consider many essential scenarios such as access rules and restrictions on usage of program entities across modules. Moreover, design review is essential when proper architectural formulations are paramount for developing and deploying a system. Untangling architectural changes, recovering semantic design, and producing design notes are the crucial tasks of the design review process. To support these tasks, we construct a lightweight tool [4] that can detect and decompose semantic slices of a commit containing architectural instances. A semantic slice consists of a description of relational information of involved modules, their classes, methods and connected modules in a change instance, which is easy to understand to a reviewer. We extract various directory and naming st ...
Authorship
Mondal, A. K., Roy, C. K., Schneider, K. A., Roy, B., Nath, S. S.
Citation
Mondal, A. K., Roy, C. K., Schneider, K. A., Roy, B., Nath, S. S. (2021). Semantic Slicing of Architectural Change Commits. In Proceedings of the 15th ACM / IEEE International Symposium on Empirical Software Engineering and Measurement (ESEM). ACM. (). https://doi.org/10.1145/3475716.3484487
Project
GWF-AWF: Agricultural Water Futures|
PublicationType
Journal Article
Year
2021
242 / 292
Publication 1.0
T-2022-12-03-41373UtzmMkCbmHtNEM9v1Q
Abstract
Software architectural changes involve more than one module or component and are complex to analyze compared to local code changes. Development teams aiming to review architectural aspects (design) of a change commit consider many essential scenarios such as access rules and restrictions on usage of program entities across modules. Moreover, design review is essential when proper architectural formulations are paramount for developing and deploying a system. Untangling architectural changes, recovering semantic design, and producing design notes are the crucial tasks of the design review process. To support these tasks, we construct a lightweight tool [4] that can detect and decompose semantic slices of a commit containing architectural instances. A semantic slice consists of a description of relational information of involved modules, their classes, methods and connected modules in a change instance, which is easy to understand to a reviewer. We extract various directory and naming st ...
Authorship
Mondal AK, Roy CK, Schneider KA, Roy B, and Nath SS
Citation
Mondal AK, Roy CK, Schneider KA, Roy B, and Nath SS, Semantic Slicing of Architectural Change Commits: Towards Semantic Design Review, in Proceedings of the 15th ACM/IEEE International Symposium on Empirical Software Engineering and Measurement (ESEM), pp. 1-6. 2021.
Project
GWF-CS: Computer Science|
PublicationType
Journal Article
Year
2021
243 / 292
Publication 1.0
T-2022-12-05-h1zLLqgIpVUaWsNh2jfj2S9A
Abstract
Lake ice is a significant component of the cryosphere due to its large spatial coverage in high-latitude regions during the winter months. The Laurentian Great Lakes are the world’s largest supply of freshwater and their ice cover has a major impact on regional weather and climate, ship navigation, and public safety. Ice experts at the Canadian Ice Service (CIS) have been manually producing operational Great Lakes image analysis charts based on visual interpretation of the synthetic aperture radar (SAR) images. In that regard, we have investigated the performance of the semi-automated segmentation algorithm “glocal” Iterative Region Growing with Semantics (IRGS) for lake ice classification using dual polarized RADARSAT-2 imagery acquired over Lake Erie. Analysis of various case studies indicated that the “glocal” IRGS algorithm could provide a reliable ice-water classification using dual polarized images with a high overall accuracy of 90.4%. However, lake ice types that are based on s ...
Authorship
Wang, J., Duguay, C. R., Clausi, D. A., Pinard, V., & Howell, S. E.
Citation
Wang, J., Duguay, C. R., Clausi, D. A., Pinard, V., & Howell, S. E. (2018). Semi-automated classification of lake ice cover using dual polarization RADARSAT-2 imagery. Remote Sensing, 10(11), 1727. https://doi.org/10.3390/rs10111727
PublicationType
Journal Article
Title
Semi-automated classification of lake ice cover using dual polarization RADARSAT-2 imagery
Year
2018
244 / 292
Publication 1.0
T-2023-01-04-s13xwpocYa0q4ouueo832zg
Authorship
Spence, C., Cavaliere, E., Clark, R., He, Z., Mantyka-Pringle, C., Mekonnen, B., Pomeroy, J.W., Shook, K., Whitfield, C., Wolfe, J.D.
Citation
Spence, C., Cavaliere, E., Clark, R., He, Z., Mantyka-Pringle, C., Mekonnen, B., Pomeroy, J.W., Shook, K., Whitfield, C., Wolfe, J.D., 2021. Simulating catchment response to climate and land use change using catchment classification and virtual basin modelling, paper 2021 annual meeting of the Society of Wetland Scientists, June, 2021.
Project
GWF-PW: Prairie Water|
PublicationType
Conference Presentation
Title
Simulating catchment response to climate and land use change using catchment classification and virtual basin modelling, paper
Year
2021
245 / 292
Publication 1.0
T-2024-07-22-u1j6SKWox4ku2u1LryD9F8bfg
Authorship
Qu, B., Roy A., Melton, J.R., et al.
Citation
Qu, B., Roy A., Melton, J.R., et al. (2022) Simulating historical and future boreal forest net ecosystem production using CLASSIC. American Geophysical Meeting, Chicago, United States of America, (December 12-16). https://agu.confex.com/agu/fm22/meetingapp.cgi/Paper/1171634
Project
GWF-NWF: Northern Water Futures|
PublicationType
Conference Presentation
Title
Simulating historical and future boreal forest net ecosystem production using CLASSIC
Year
2022
246 / 292
Publication 1.0
T-2024-10-30-u1dqGhUxyA06RFphVrgn5xw
Abstract
Permafrost thaw is causing a rapid evolution of the lowland discontinuous permafrost regions of the Taiga Plains in Northern Canada and elsewhere in the Northern Hemisphere. Notably, this thaw is changing the spatial distribution of the dominant hydrologic land cover types (permafrost plateaus, fens, and isolated bogs) in parts of the Northwest Territories (NWT), Canada. Here, we develop a multinomial time series land cover model (TSLCM) to simulate historical land cover transitions, model spatial patterns of transition, and predict the long term evolution of land cover in the areas surrounding the Scotty Creek Research Station (SCRS), NWT, and similar discontinuous permafrost landscapes. The machine learning-based TSLCM is informed by a set of observed spatio-temporal variables. The independent variables represent driving factors of change, and include the estimated summertime land surface temperature anomaly (LST), the distance and a custom cost distance to land cover interfaces, tim ...
Authorship
Akbarpour Shaghayegh, Craig James R.
Citation
Akbarpour Shaghayegh, Craig James R. (2022) Simulating thaw-induced land cover change in discontinuous permafrost landscapes, Remote Sensing Applications: Society and Environment, Volume 28, 2022, 100829, ISSN 2352-9385
Project
GWF-NWF: Northern Water Futures|
PublicationType
Journal Article
Year
2022
247 / 292
Publication 1.0
T-2023-01-11-s1JtZ9190k0q3mBkNXu1plA
Authorship
Bo, Q., Roy, A., Melton, J., & Sonnentag, O.
Citation
Bo, Q., Roy, A., Melton, J., & Sonnentag, O. (2020). Site-level simulations of water and carbon balances in North American boreal forests across permafrost-free and permafrost regions using CLASSIC. Colloque annuel du Centre d'études nordiques. Université du Québec à Montréal, Québec, Canada. Conference Presentation
PublicationType
Conference Presentation
Title
Site-level simulations of water and carbon balances in North American boreal forests across permafrost-free and permafrost regions using CLASSIC
Year
2020
248 / 292
Publication 1.0
T-2023-01-04-N1OQOZ78ry0iHBavBypza2w
Abstract
Snow is an essential component in hydrology systems, and more speci cally, monitoring variations in snow cover can provide valuable information about water supply, wildlife habitats, and climate changes. In recent years, the potential of wide band snow radar (e.g. 2-8 GHz) has been discovered with a series of campaigns in Operation IceBrdige (OIB). Due to data from OIB mainly focusing on sea ice, most of the algorithms were also developed for snow on sea ice. As a result, this thesis aimed to test the applicability of the interface-based pulse peakiness snow depth retrieval method to snow on land. In addition, due to the common usage of radar altimeter in sea ice classi cation, this thesis also explored the possibility of adapting some of the ideas in sea ice classi cation to develop another retrieval method. Both approaches were tested on the 6 major vegetation types (tree, tall shrub, riparian shrub, dwarf shrub, tussock, and lichen) in the study area. Snow depth derived from Airborn ...
Authorship
Wang, W.
Citation
Wang, W. (2022) Snow Depth Retrieval from Wide Band Radar in Trail Valley Creek. University of Waterloo. https://uwspace.uwaterloo.ca/handle/10012/17915
Project
GWF-TSTSW: Transformative Sensor Technologies and Smart Watersheds|
PublicationType
Thesis
Year
2022
249 / 292
Publication 1.0
T-2024-12-19-J1qGjD6CJ10UGCvPkxMjEeRQ
Abstract
Software is solely designed, implemented, tested, and inspected by expert people, unlike other engineering projects where they are mostly implemented by workers (non-experts) after designing by engineers. Researchers and practitioners have linked software bugs, security holes, problematic integration of changes, complex-to-understand codebase, unwarranted mental pressure, and so on in software development and maintenance to inconsistent and complex design and a lack of ways to easily understand what is going on and what to plan in a software system. The unavailability of proper information and insights needed by the development teams to make good decisions makes these challenges worse. Therefore, software design documents and other insightful information extraction are essential to reduce the above mentioned anomalies. Moreover, architectural design artifacts extraction is required to create the developer’s profile to be available to the market for many crucial scenarios. To that end, ...
Authorship
Mondal, Amit Kumar
Citation
Mondal, Amit Kumar (2023) Software Design Change Artifacts Generation through Software Architectural Change Detection and Categorisation, USASK Harvest - Theses and Dissertations, https://hdl.handle.net/10388/14448
PublicationType
Thesis
Year
2023
250 / 292
Publication 1.0
T-2025-08-10-l1ILXJaXJ4EOwShV9ps9yNQ
Abstract
The soil moisture active passive (SMAP) validation experiment in the boreal forest took place near Candle Lake, Saskatchewan within an area previously studied as a part of the experiments conducted at the Boreal Ecosystem Research and Monitoring Sites (BERMS). This study specifically focuses on the data collected within a single SMAP radiometer footprint, covering an area of approximately 30 × 30 km2 within a boreal forest environment. The land cover classes and soil types in the boreal forest area of the BERMS region are dominated by coniferous trees and soils represented by an often-thick, organic-rich layer of moss and leaf litter above a mineral soil layer. The completed field experiment focused on accurately representing both soils and vegetation of the region based on comprehensive sampling campaigns completed over two sampling periods between 16–30 June and 6–18 August 2022. Numerous datasets were collected from sampling campaigns and through the installation of in situ networks ...
Authorship
Berg, A. A., Wicks, K., Ambadan, J. T., Roy, A., Magagi, R., Helgason, W.
Citation
Berg, A. A., Wicks, K., Ambadan, J. T., Roy, A., Magagi, R., & Helgason, W. (2025) Soil Moisture Active/Passive Validation Experiment Within the Canadian Boreal Forest in 2022 (SMAPVEX22-Boreal), IEEE Journal of Selected Topics in Applied Earth Observations and Remote Sensing ( Volume: 18) https://doi.org/10.1109/JSTARS.2025.3564195
Project
GWF-TSTSW: Transformative Sensor Technologies and Smart Watersheds|
PublicationType
Journal Article
Year
2025
251 / 292
Publication 1.0
T-2025-08-10-p1cilUFLZn0ywO02POhrTDA
Abstract
The soil moisture active passive (SMAP) validation experiment in the boreal forest took place near Candle Lake, Saskatchewan within an area previously studied as a part of the experiments conducted at the Boreal Ecosystem Research and Monitoring Sites (BERMS). This study specifically focuses on the data collected within a single SMAP radiometer footprint, covering an area of approximately 30 × 30 km2 within a boreal forest environment. The land cover classes and soil types in the boreal forest area of the BERMS region are dominated by coniferous trees and soils represented by an often-thick, organic-rich layer of moss and leaf litter above a mineral soil layer. The completed field experiment focused on accurately representing both soils and vegetation of the region based on comprehensive sampling campaigns completed over two sampling periods between 16–30 June and 6–18 August 2022. Numerous datasets were collected from sampling campaigns and through the installation of in situ networks ...
Authorship
Berg, A. A., Wicks, K., Ambadan, J. T., Roy, A., Magagi, R., Helgason, W.
PublicationType
Journal Article
Year
2025
252 / 292
Publication 1.0
T-2025-11-30-k1HML7TYXek1aheVc4BFEfLQ
Abstract
The biogeochemical functioning of natural and engineered environments is closely linked to spatial and temporal variations in molecular oxygen (O2) concentrations. A luminescence-based, Multi-Fibre Optode (MuFO) microsensor technique was developed to measure O2 concentrations in fully and partially water-saturated systems. The technique relies on the conversion of high-resolution digital images of sensor-emitted light into O2 concentrations using the classical Stern-Volmer (SV) and Lehrer equations. The method was tested in two soil column experiments designed to simulate water table fluctuations (WT) and freeze-thaw cycles (FTC) under controlled conditions. The columns were filled with a homogenized mixture of peat (20 %) and sand (80 %). Depth distributions of O2 concentration were monitored without interruption for 20 (WT experiment) and 39 days (FTC experiment), while CO2 effluxes from the soils were measured periodically. Increases in CO2 emission accompanied both thawing (FTC exp ...
Authorship
Milojevic, T.
Project
GWF-SSSWQM: Sensors and Sensing Systems for Water Quality Monitoring|
PublicationType
Thesis
Year
2017
253 / 292
Publication 1.0
T-2024-10-30-p1nTmhyvp1U0S9D2wa53ulLQ
Abstract
Drainage leads to trade-offs between crop production efficiency and wetland conservation, with complex impacts on ecosystem services. In North America’s Prairie Pothole Region, wetland drainage is widespread, often to increase the available land for cultivation, prevent crop loss due to flooding, and manage soil salinity. Wetlands are known for providing key ecosystem services such as improved water quality, flood mitigation, and carbon storage. There is limited research on how changes to soil hydrology and soil redistribution through wetland drainage can impact soil carbon storage and persistence in this region. This research evaluates factors that contribute to soil carbon storage in drained prairie pothole wetland based on 33 drained wetlands in Saskatchewan, Canada. These analyses showed regional differences in the response of soil carbon storage to drainage that are driven by environmental factors such as annual precipitation, temperature, and wetland permanence. We observed incre ...
Authorship
Chizen CJ, Helgason BL, Weiseth B, Dhillon GS, Baulch HM, Schoenau JJ, Bedard-Haughn AK
Citation
Chizen CJ, Helgason BL, Weiseth B, Dhillon GS, Baulch HM, Schoenau JJ, Bedard-Haughn AK (2024) Soil carbon dynamics in drained prairie pothole wetlands, Front. Environ. Sci. 12:1353802. doi: 10.3389/fenvs.2024.1353802
PublicationType
Journal Article
Year
2024
254 / 292
Publication 1.0
T-2022-12-05-N1372zAsRfEiWhq2uIWB1DQ
Abstract
Increased fire frequency, extent and severity are expected to strongly affect the structure and function of boreal forest ecosystems. In this study, we examined 213 plots in boreal forests dominated by black spruce (Picea mariana) or jack pine (Pinus banksiana) of the Northwest Territories, Canada, after an unprecedentedly large area burned in 2014. Large fire size is associated with high fire intensity and severity, which would manifest as areas with deep burning of the soil organic layer (SOL). Our primary objectives were to estimate burn depth in these fires and then to characterise landscapes vulnerable to deep burning throughout this region. Here we quantify burn depth in black spruce stands using the position of adventitious roots within the soil column, and in jack pine stands using measurements of burned and unburned SOL depths. Using these estimates, we then evaluate how burn depth and the proportion of SOL combusted varies among forest type, ecozone, plot-level moisture and s ...
Authorship
Walker, X. J., Baltzer, J. L., Cumming, S. G., Day, N. J., Johnstone, J. F., Rogers, B. M., Solvik, K., Turetsky, M.R., & Mack, M. C.
Citation
Walker, X. J., Baltzer, J. L., Cumming, S. G., Day, N. J., Johnstone, J. F., Rogers, B. M., Solvik, K., Turetsky, M.R., & Mack, M. C. (2018). Soil organic layer combustion in boreal black spruce and jack pine stands of the Northwest Territories, Canada. International Journal of Wildland Fire, 27(2), 125-134. https://doi.org/10.1071/WF17095
PublicationType
Journal Article
Year
2018
255 / 292
Publication 1.0
T-2022-12-03-b11ZIzUOeuky76m9mcxOYLg
Abstract
Study region
Italy.
Study focus
Knowing magnitude and frequency of extreme precipitation is necessary to reduce their impact on vulnerable areas. Here we investigate the performance of the Generalized Extreme Value () distribution, using a fine-resolution satellite-based gridded product, to analyze 13,247 daily rainfall annual maxima samples. A non-extreme value distribution with a power-type behavior, that is, the Burr Type XII (), is also evaluated and used to test the reliability of the in describing extreme rainfall.
New hydrological insights for the region
(1) in 44.9 % of the analyzed samples the predicts an upper rainfall limit; we deem this is an artifact due to sample variations; (2) we suggest the distribution, that is, the with shape parameters restricted only to positive values as a more consistent model complying with the nature of extreme precipitation; (3) , , and performed equally well in describing the observed annual precipitation, yet all distributions underes ...
Authorship
Moccia, B., Papalexiou, S. M., Russo, F., & Napolitano, F.
Citation
Moccia, B., Papalexiou, S. M., Russo, F., & Napolitano, F. (2021). Spatial variability of precipitation extremes over Italy using a fine-resolution gridded product. Journal of Hydrology: Regional Studies, 37, 100906. https://doi.org/10.1016/j.ejrh.2021.100906
PublicationType
Journal Article
Year
2021
256 / 292
Publication 1.0
T-2021-11-14-E1jaWOWzaSUeWNB941QgJBg
Abstract
In an effort to feed a growing world population, agriculture has rapidly intensified over the last six decades, relying heavily on agrochemicals (fertilizers, insecticides, fungicides, and herbicides) to increase and maintain desired crop yields. Despite environmental concerns in Canada’s agricultural regions, long-term patterns of changing crops and the associated trends in the proportion of cropland treated with agrochemicals are poorly documented. Using the Canadian Census of Agriculture, we compiled historical data over 35 years (eight census periods: 1981–2016) on agrochemical applications, measured as the proportion of cropland treated with pesticides and fertilizers and the associated crop classes, to identify and interpret spatial and temporal trends in Canada’s agricultural practices across 260 census units. Due to differences in agricultural practices, soil, and climatic conditions across the country, the Pacific (British Columbia), Prairie (Alberta, Saskatchewan, Manitoba), ...
Authorship
Malaj, E., Freistadt, L., & Morrissey, C. A.
Citation
Malaj, E., Freistadt, L., & Morrissey, C. A. (2020). Spatio-temporal patterns of crops and agrochemicals in Canada over 35 years. Frontiers in Environmental Science. 8 (208) doi: 10.3389/fenvs.2020.556452
Project
GWF-PW: Prairie Water|
PublicationType
Journal Article
Year
2020
257 / 292
Publication 1.0
T-2024-12-19-o1o2NCcez1pkiczXETYW09Xg
Abstract
Scientific workflows have emerged as well-established pillars of large-scale computational science and appeared as torchbearers to formalize and structure a massive amount of complex heterogeneous data and accelerate scientific progress. Scientists of diverse domains can analyze their data by constructing scientific workflows as a useful paradigm to manage complex scientific computations. A workflow can analyze terabyte-scale datasets, contain numerous individual tasks, and coordinate between heterogeneous tasks with the help of scientific workflow management systems (SWfMSs). However, even for expert users, workflow creation is a complex task due to the dramatic growth of tools and data heterogeneity. Scientists are now more willing to publicly share scientific datasets and analysis pipelines in the interest of open science. As sharing of research data and resources increases in scientific communities, scientists can reuse existing workflows shared in several workflow repositories. Un ...
Authorship
Alam, Khairul
Citation
Alam, Khairul (2023) Supporting complex workflows for data-intensive discovery reliably and efficiently, USASK Harvest - Theses and Dissertations, https://hdl.handle.net/10388/14661
PublicationType
Thesis
Year
2023
258 / 292
Publication 1.0
T-2022-12-03-z1oVvPXgy60Sz21XKJu47wHA
Abstract
Reading through code, finding relevant methods, classes and files takes a significant portion of software development time. Having good tool support for this code browsing activity can reduce human effort and increase overall developer productivity. To help with program comprehension activities, building an abstract code summary of a software system from its call graph is an active research area. A call graph is a visual representation of the caller-callee relationships between different methods of a software system. Call graphs can be difficult to comprehend for a large code-base. Previous work by Gharibi et al. on abstract code summarizing suggested using the Agglomerative Hierarchical Clustering (AHC) tree for understanding the codebase. Each node in the tree is associated with the top five method names. When we replicated the previous approach, we observed that the number of nodes in the AHC tree is burdensome for developers to explore. We also noticed only five method names for ea ...
Authorship
Bhattacharjee A, Roy B, and Schneider KA
Citation
Bhattacharjee, A., Roy, B., and Schneider, K. A., (2022). Supporting program comprehension by generating abstract code summary tree. in Proceedings of the 44th International Conference on Software Engineering (ICSE 2022) New Ideas and Emerging Results track, 5pp., Pittsburgh, PA, USA, May 2022. https://doi.org/10.1145/3510455.3512793
Project
GWF-CS: Computer Science|
PublicationType
Journal Article
Year
2022
259 / 292
Publication 1.0
T-2024-12-19-g193HFg3PQg306Xv4CRdwrhzg1
Abstract
Colloidally-stable zero valent iron nanoparticles (nZVI) were synthesized through a classical redox reaction of iron sulfate with minor modifications using cellulose nanocrystals (CNCs) as stabilizers. We obtained spherical nZVI particles with high surface roughness and a mean size of 130nm. Particles remain colloidally stable after more than two months. Cellulose nanocrystals play a dual role in nZVI stability: a foreign surface to encourage stable nucleation over fast aggregation and a stabilizer to prevent iron nanoparticles aggregating into fractal colloids. Our results highlight the impact of the presence of CNCs on the rates and mechanisms of nucleation, growth, aggregation, and aging of nZVI particles, indicating promise in controlling size and morphology of similarly redox-generated nanoparticles. Cellulose nanocrystal-stabilized nZVI nanoparticles demonstrate properties well-suited for enhanced soil and groundwater remediation. //Nanocomposites composed of carboxylated cellulo ...
Authorship
Ruiz-Caldas, Maria-Ximena
Citation
Ruiz-Caldas, Maria-Ximena (2018) Synthesis of iron nanoparticles mediated by cellulose nanocrystals, MacSphere Open Access Dissertations and Theses, http://hdl.handle.net/11375/24823
PublicationType
Thesis
Year
2018
260 / 292
Publication 1.0
T-2022-12-03-636162dRaCY8kGC1XaE62aIAgQ
Abstract
Methane emissions from boreal and arctic wetlands, lakes, and rivers are expected to increase in response to warming and associated permafrost thaw. However, the lack of appropriate land cover datasets for scaling field-measured methane emissions to circumpolar scales has contributed to a large uncertainty for our understanding of present-day and future methane emissions. Here we present the Boreal–Arctic Wetland and Lake Dataset (BAWLD), a land cover dataset based on an expert assessment, extrapolated using random forest modelling from available spatial datasets of climate, topography, soils, permafrost conditions, vegetation, wetlands, and surface water extents and dynamics. In BAWLD, we estimate the fractional coverage of five wetland, seven lake, and three river classes within 0.5 × 0.5∘ grid cells that cover the northern boreal and tundra biomes (17 % of the global land surface). Land cover classes were defined using criteria that ensured distinct methane emissions among classes, ...
Authorship
Olefeldt, D., Hovemyr, M., McKenzie, A.K. et al. incl. Sonnentag, O.
Citation
Olefeldt, D., Hovemyr, M., McKenzie, A.K. et al. incl. Sonnentag, O.: The Boreal-Arctic Wetland and Lake Dataset (BAWLD), Earth System Science Data, 13, 5127-5149, https://doi.org/10.5194/essd-13-5127-202, 2021
Project
GWF-NWF: Northern Water Futures|
PublicationType
Journal Article
Year
2021
261 / 292
Publication 1.0
T-2022-04-24-91VKw8IesPEu3S76Obxsk92g
Abstract
Climate change is raising average temperatures, altering rain and snowfall patterns, thawing permafrost, increasing the frequency and intensity of extreme weather, and raising sea levels within Canada. This is leading to specific impacts for water resources, which affect water availability and quality. The nature and timing of water-related hazards such as floods and droughts are also exacerbated. Climate change, combined with human developments, have led to a range of impacts and risks that intersect with water systems, including damaged infrastructure, deteriorating water quality, and ecosystem impacts. These impacts and risks affect Canadians in a different ways depending on their geographic location, sector of interest, and time of year.
Canadian organizations and institutions that manage water-related risks require easily accessible climate data necessary to understand these impacts and risks and prioritize adaptation efforts. The Canadian Centre for Climate Services (CCCS) offer ...
Authorship
Clunas Casey
Citation
Casey Clunas (2022). The Canadian Centre for Climate Services: Climate information for managing water-related risks. Proceedings of the GWF Annual Open Science Meeting, May 16-18, 2022.
PublicationType
Conference Presentation
Year
2022
262 / 292
Publication 1.0
T-2023-01-14-h1QFPNnYNl0eTvU1jAM8m8Q
Authorship
Hrach, D., & Petrone, R. M.
Citation
Hrach, D., & Petrone, R. M. (2019, July 8-18). The Influence of Shade and Complex Topography on the Classification, Climate, and Energy Balance of a Sub-alpine Wetland. International Union of Geodesy and Geophysics Centennial (27th) General Assembly, 8 - 18 July, Montreal, Quebec, Canada. Conference Presentation
PublicationType
Conference Presentation
Title
The Influence of Shade and Complex Topography on the Classification, Climate, and Energy Balance of a Sub-alpine Wetland
Year
2019
263 / 292
Publication 1.0
T-2021-11-14-J1uDfya2DqkqJ1nDmnP4l6yQ
Abstract
Snowmelt contributions to streamflow in mid-latitude mountain basins typically dominate other runoff sources on annual and seasonal timescales. Future increases in temperature and changes in precipitation will affect both snow accumulation and seasonal runoff timing and magnitude, but the underlying and fundamental roles of mountain basin geometry and hypsometry on snowmelt sensitivity have received little attention. To investigate the role of basin geometry in snowmelt sensitivity, a linear snow accumulation model and the Cold Regions Hydrological Modeling (CRHM) platform driven are used to estimate how hypsometry affects basin-wide snow volumes and snowmelt runoff. Area-elevation distributions for fifty basins in western Canada were extracted, normalized according to their elevation statistics, and classified into three clusters that represent top-heavy, middle, and bottom-heavy basins. Prescribed changes in air temperature alter both the snow accumulation gradient and the total snow ...
Authorship
Shea, J.M., Whitfield, P.H., Fang, X., Pomeroy, J.W.
Citation
Shea, J.M., Whitfield, P.H., Fang, X., Pomeroy, J.W. (2021) The Role of Basin Geometry in Mountain Snowpack Responses to Climate Change. Frontiers in Water. 3(604275): 1-18. https://doi.org/10.3389/frwa.2021.604275
Project
GWF-MWF: Mountain Water Futures|
PublicationType
Journal Article
Year
2021
264 / 292
Publication 1.0
T-2024-12-20-p1otkq5CjdUp2Qr92o8xei7A
Abstract
Quantifying water and energy fluxes are critical to understand how water is moved and stored on the landscape. These measurements are important for flood and drought forecasting, water resources management, and large-scale numerical weather prediction models. Moreover, land surface model’s (LSMs) which are hydrological tools used to predict and forecast water and energy fluxes, rely on these measurements to calibrate and validate their predictions. To evaluate hydrological fluxes and in turn water storage, representative observations are needed to capture the temporal and spatial dynamics of water on the landscape. However, hydrological fluxes are often difficult to measure and are limited to specific fluxes and spatial resolutions. Geological Weighing Lysimeters (GWL) are novel instruments that provide measurements of total integrated water storage at scales of 102 m2 and 106 m2 (field-scale). These tools use a saturated formations response to changes in mechanical loading, to estimat ...
Authorship
Braaten, Morgan M
Citation
Braaten, Morgan M (2023) The Weight of Water: Using a Geological Weighing Lysimeter to Quantify the Field-Scale Water Balance, USASK Harvest - Theses and Dissertations, https://hdl.handle.net/10388/14469
PublicationType
Thesis
Year
2023
265 / 292
Publication 1.0
T-2021-11-14-B1uRth2LySkKB1hWFMuKQRYQ
Abstract
Aufeis, also known as an icing or naled, is an accumulation of ice that forms primarily during winter when water is expelled onto frozen ground or ice surfaces and freezes in layers. Process-oriented aufeis research initially expanded in the 20th century, but recent interest in changing hydrological conditions in permafrost regions has rejuvenated this field. Despite its societal relevance, the controls on aufeis distribution and dynamics are not well defined and this impedes projections of variation in aufeis size and distribution expected to accompany climate change. This paper reviews the physical controls on aufeis development, current broad-scale aufeis distribution and anticipated change, and approaches to aufeis investigation. We propose an adjustment to terminology to better distinguish between the formation process and resulting ice bodies, a clarification of the aufeis classification approach based on source water, and a size threshold for broad-scale aufeis inventory to faci ...
Authorship
Ensom, T., Makarieva, O., Morse, P., Kane, D., Alekseev, V., & Marsh, P.
Citation
Ensom, T., Makarieva, O., Morse, P., Kane, D., Alekseev, V., & Marsh, P. (2020). The distribution and dynamics of aufeis in permafrost regions, Permafrost and Periglacial Processes, 31, 383-395, https://doi.org/10.1002/ppp.2051
Project
GWF-NWF: Northern Water Futures|
PublicationType
Journal Article
Year
2020
266 / 292
Publication 1.0
T-2021-11-14-n1XG3OqmRn30yiaMeYkn3hgtg
Abstract
Performance in simulating atmospheric rivers (ARs) over western North America based on AR frequency and landfall latitude is evaluated for 10 models from phase 5 of the Coupled Model Intercomparison Project among which the CanESM2 model performs well. ARs are classified into southern, northern, and middle types using self-organizing maps in the ERA-Interim reanalysis and CanESM2. The southern type is associated with the development and eastward movement of anomalous lower pressure over the subtropical eastern Pacific, while the northern type is linked with the eastward movement of anomalous cyclonic circulation stimulated by warm sea surface temperatures over the subtropical western Pacific. The middle type is connected with the negative phase of North Pacific Oscillation–west Pacific teleconnection pattern. CanESM2 is further used to investigate projected AR changes at the end of the twenty-first century under the representative concentration pathway 8.5 scenario. AR definitions usual ...
Authorship
Tan, Y., Zwiers, F., Yang, S., Li, C., & Deng, K.
Citation
Tan, Y., Zwiers, F., Yang, S., Li, C., & Deng, K. (2020). The role of circulation and its changes in present and future atmospheric rivers over western North America. Journal of Climate, 33(4), 1261-1281. https://doi.org/10.1175/JCLI-D-19-0134.1
Project
GWF-CPE: Climate-Related Precipitation Extremes|GWF-SDEPFC: Short-Duration Extreme Precipitation in Future Climate|
PublicationType
Journal Article
Year
2020
267 / 292
Publication 1.0
T-2021-11-12-o1dxBHZRPVE6DDNrDsG76VQ
Abstract
East of the Continental Divide in the cold interior of Western Canada, the Mackenzie and Nelson River basins have some of the world's most extreme and variable climates, and the warming climate is changing the landscape, vegetation, cryosphere, and hydrology. Available data consist of streamflow records from a large number (395) of natural (unmanaged) gauged basins, where flow may be perennial or temporary, collected either year-round or during only the warm season, for a different series of years between 1910 and 2012. An annual warm-season time window where observations were available across all stations was used to classify (1) streamflow regime and (2) seasonal trend patterns. Streamflow trends were compared to changes in satellite Normalized Difference Indices.
Clustering using dynamic time warping, which overcomes differences in streamflow timing due to latitude or elevation, identified 12 regime types. Streamflow regime types exhibit a strong connection to location; there is a ...
Authorship
Whitfield, P. H., Kraaijenbrink, P. D., Shook, K. R., & Pomeroy, J. W.
Citation
Whitfield, P. H., Kraaijenbrink, P. D., Shook, K. R., & Pomeroy, J. W. (2021). The spatial extent of hydrological and landscape changes across the mountains and prairies of Canada in the Mackenzie and Nelson River basins based on data from a warm-season time window. Hydrology and Earth System Sciences, 25(5), 2513-2541.
Project
INARCH2/COPE: International Network of Alpine Research Catchment Hydrology (Phase 2)/Common Observation Period Experiment|
PublicationType
Journal Article
Summary
Using only warm season streamflow records, regime and change classifications were produced for ~ 400 watersheds in the Nelson and Mackenzie River basins, and trends in water storage and vegetation were detected from satellite imagery. Three areas show consistent changes: north of 60° (increased streamflow and basin greenness), in the western Boreal Plains (decreased streamflow and basin greenness), and across the Prairies (three different patterns of increased streamflow and basin wetness).
Year
2021
268 / 292
Publication 1.0
T-2022-04-24-g1Wb3M94eJ0WYdQbnKjOhg1Q
Abstract
Model calibration and validation are critical in hydrological model robustness assessment. Unfortunately, the commonly used split-sample test (SST) framework for data splitting requires modelers to make subjective decisions without clear guidelines. Unlike most SST studies that use two sub-periods (i.e., calibration and validation) to build models, this study incorporates an independent model testing period in addition to calibration and validation periods. Two hydrological models are calibrated and tested in 463 CAMELS catchments across the United States using 50 different data splitting schemes. These schemes are established regarding the data availability, length, and data recentness of the continuous calibration sub-periods (CSPs). A full-period CSP is also included in the experiment, which skips model validation entirely. The results are synthesized regarding the large sample of catchments and are comparatively assessed in multiple novel ways, including how model building decision ...
Authorship
Shen Hongren, Tolson Bryan A., Mai Juliane
Citation
Hongren Shen, Bryan A. Tolson, Juliane Mai (2022). Time to Update the Split Sample Approach to Hydrological Model Calibration. Proceedings of the GWF Annual Open Science Meeting, May 16-18, 2022.
Project
GWF-IMPC: Integrated Modelling Program for Canada|
PublicationType
Conference Presentation
Year
2022
269 / 292
Publication 1.0
T-2022-12-03-u1rf5oQMQEUWbV9lWu2llsQw
Abstract
Model calibration and validation are critical in hydrological model robustness assessment. Unfortunately, the commonly used split-sample test (SST) framework for data splitting requires modelers to make subjective decisions without clear guidelines. This large-sample SST assessment study empirically assesses how different data splitting methods influence post-validation model testing period performance, thereby identifying optimal data splitting methods under different conditions. This study investigates the performance of two lumped conceptual hydrological models calibrated and tested in 463 catchments across the United States using 50 different data splitting schemes. These schemes are established regarding the data availability, length and data recentness of continuous calibration sub-periods (CSPs). A full-period CSP is also included in the experiment, which skips model validation. The assessment approach is novel in multiple ways including how model building decisions are framed a ...
Authorship
Shen, H., B. A. Tolson and J. Mai
Citation
Shen, H., B. A. Tolson and J. Mai (2022). Time to Update the Split-Sample Approach in Hydrological Model Calibration, Water Resources Research, 58, e2021WR031523. https://doi.org/10.1029/2021WR031523.
Project
GWF-IMPC: Integrated Modelling Program for Canada|
PublicationType
Journal Article
Year
2022
270 / 292
Publication 1.0
T-2022-12-05-81Zrt5gpblku9G83kn822rcZQ
Abstract
Wildfires, which constitute the most extensive natural disturbance of the boreal biome, produce a broad range of ecological impacts to vegetation and soils that may influence post-fire vegetation assemblies and seedling recruitment. We inventoried post-fire understory vascular plant communities and tree seedling recruitment in the northwestern Canadian boreal forest and characterized the relative importance of fire effects and fire history, as well as non-fire drivers (i.e., the topoedaphic context and climate), to post-fire vegetation assemblies. Topoedaphic context, pre-fire forest structure and composition, and climate primarily controlled the understory plant communities and shifts in the ranked dominance of tree species (***8% and **13% of variance explained, respectively); however, fire and fire-affected soils were significant secondary drivers of post-fire vegetation. Wildfire had a significant indirect effect on understory vegetation communities through post-fire soil propertie ...
Authorship
Whitman, E., Parisien, M. A., Thompson, D. K., & Flannigan, M. D.
Citation
Whitman, E., Parisien, M. A., Thompson, D. K., & Flannigan, M. D. (2018). Topoedaphic and forest controls on post-fire vegetation assemblies are modified by fire history and burn severity in the northwestern Canadian boreal forest. Forests, 9(3), 151. https://doi.org/10.3390/f9030151
PublicationType
Journal Article
Year
2018
271 / 292
Publication 1.0
T-2024-12-20-M1ROk3Ump8USUXiZTHOoICQ
Abstract
Existing software engineering tools have proved useful in automating some aspects of the code review process, from uncovering defects to refactoring code. However, given that software teams still spend large amounts of time performing code reviews despite the use of such tools, much more research remains to be carried out in this area. This dissertation present two major contributions to this field. First, we perform a text classification experiment over thirty thousand GitHub review comments to understand what code reviewers typically discuss in reviews. Next, in an attempt to offer an innovative, data-driven approach to automating code reviews, we leverage probabilistic models of source code and graph embedding techniques to perform human-like code inspections. Our experimental results indicate that the proposed algorithm is able to emulate human-like code inspection behaviour in code reviews with a macro f1-score of 62%, representing an impressive contribution towards the relatively ...
Authorship
Fadhel, Muntazir
Citation
Fadhel, Muntazir (2020) Towards Automating Code Reviews, MacSphere Open Access Dissertations and Theses, http://hdl.handle.net/11375/25269
PublicationType
Thesis
Year
2020
272 / 292
Publication 1.0
T-2023-01-20-X11PDRb3qhEOX1fFhk8bX2EVw
Authorship
Soulis, E.D., K.R. Snelgrove, N. Kouwen, F. Seglenieks and D. Verseghy
Citation
Soulis, E.D., K.R. Snelgrove, N. Kouwen, F. Seglenieks and D. Verseghy, (2000). Towards closing the vertical water balance in Canadian atmospheric models: Coupling of the land surface scheme CLASS with the distributed hydrological model WATFLOOD. Atmosphere-Ocean 38, 251-269.
PublicationType
Journal Article
Title
Towards closing the vertical water balance in Canadian atmospheric models: Coupling of the land surface scheme CLASS with the distributed hydrological model WATFLOOD
Year
2000
273 / 292
Publication 1.0
T-2021-11-12-p1aPQKtV5lU2BVp1lT5iStfw
Abstract
Glacier melt is an important fresh water source. Seasonal changes can have impacting consequences on downstream water resources management. Today’s glacier monitoring lacks an observation-based tool for regional, sub-seasonal observation of glacier mass balance and a quantification of associated meltwater release at high temporal resolution. The snowline on a glacier marks the transition between the ice and snow surface, and is, at the end of the summer, a proxy for the annual glacier mass balance. It was shown that glacier mass balance model simulations closely tied to sub-seasonal snowline observations on optical satellite sensors are robust for the observation date. Recent advances in remote sensing permit efficient and extensive snowline mapping. Different methods automatically discriminate snow over ice on high- to medium-resolution optical satellite images. Other studies rely on lower ground resolution optical imagery to retrieve snow cover fraction at pixel level and produce re ...
Authorship
Barandun, M., Callegari, M., Strasser, U., & Notarnicola, C.
Citation
Barandun, M., Callegari, M., Strasser, U., & Notarnicola, C. (2021, September). Towards daily snowline observations on glaciers using multi-source and multi-resolution satellite data. In Microwave Remote Sensing: Data Processing and Applications (Vol. 11861, p. 1186108). SPIE.
Project
INARCH1: International Network of Alpine Research Catchment Hydrology (Phase 1)|
PublicationType
Journal Article
Year
2021
274 / 292
Publication 1.0
T-2024-10-30-I1OG2jberxE641CwQRp7c2w
Abstract
Land surface models have many parameters that have a spatially variable impact on model outputs. In applying these models, sensitivity analysis (SA) is sometimes performed as an initial step to select calibration parameters. As these models are applied to large domains, performing sensitivity analysis across the domain is computationally prohibitive. Here, using a Variable Infiltration Capacity model (VIC) deployment to a large domain as an example, we show that watershed classification based on climatic attributes and vegetation land cover helps to identify the spatial pattern of parameter sensitivity within the domain at a reduced cost. We evaluate the sensitivity of 44 VIC model parameters with regard to streamflow, evapotranspiration and snow water equivalent over 25 basins with a median size of 5078 km2. Basins are clustered based on their climatic and land cover attributes. Performance in transferring parameter sensitivity between basins of the same cluster is evaluated by the F1 ...
Authorship
Larabi, S., Mai, J., Schnorbus, M., Tolson, B. A., Zwiers, F.
Citation
Larabi, S., Mai, J., Schnorbus, M., Tolson, B. A., Zwiers, F. (2023) Towards reducing the high cost of parameter sensitivity analysis in hydrologic modeling: a regional parameter sensitivity analysis approach, Hydrology and Earth System Sciences, 27(17), 3241-3263
PublicationType
Journal Article
Year
2023
275 / 292
Publication 1.0
T-2021-11-12-613CfNVUYfkagY1g82t1Lew
Abstract
Uncertainties of snowpack models and of their meteorological forcings limit their use by avalanche hazard forecasters, or for glaciological and hydrological studies. The spatialized simulations currently available for avalanche hazard forecasting are only assimilating sparse meteorological observations. As suggested by recent studies, their forecasting skills could be significantly improved by assimilating satellite data such as snow reflectances from satellites in the visible and the near-infrared spectra. Indeed, these data can help constrain the microstructural properties of surface snow and light absorbing impurities content, which in turn affect the surface energy and mass budgets. This paper investigates the prerequisites of satellite data assimilation into a detailed snowpack model. An ensemble version of Météo-France operational snowpack forecasting system (named S2M) was built for this study. This operational system runs on topographic classes instead of grid points, so-called ...
Authorship
Cluzet, B., J. Revuelto, M. Lafaysse, F. Tuzet, E. Cosme, G. Picard, L. Arnaud and M. Dumont
Citation
Cluzet, B., J. Revuelto, M. Lafaysse, F. Tuzet, E. Cosme, G. Picard, L. Arnaud and M. Dumont (2020) Towards the assimilation of satellite reflectance into semi-distributed ensemble snowpack simulations, Cold Regions Science and Technology, 170, https://doi.org/10.1016/j.coldregions.2019.102918
Project
INARCH1: International Network of Alpine Research Catchment Hydrology (Phase 1)|
PublicationType
Journal Article
Year
2020
276 / 292
Publication 1.0
T-2023-11-06-b1fhJfDh1qkm2heVa6nVAfg
Abstract
Accurate and frequent mapping of transient wetland inundation in the boreal region is critical for monitoring the ecological and societal functions of wetlands. Satellite Synthetic Aperture Radar (SAR) has long been used to map wetlands due to its sensitivity to surface inundation and ability to penetrate clouds, darkness, and certain vegetation canopies. Here, we track boreal wetland inundation by developing a two-step modified decision-tree algorithm implemented in Google Earth Engine using Sentinel-1 C-band SAR and Sentinel-2 Multispectral Instrument (MSI) time-series data as inputs. This approach incorporates temporal as well as spatial characteristics of SAR backscatter and is evaluated for the Peace-Athabasca Delta, Alberta (PAD), and Yukon Flats, Alaska (YF) from May 2017 to October 2019. Within these two boreal study areas, we map spatiotemporal patterns in wetland inundation classes of Open Water (OW), Floating Plants (FP), Emergent Plants (EP), and Flooded Vegetation (FV). Te ...
Authorship
Huang, C., Smith, L. C., Kyzivat, E. D., Fayne, J. V., Ming, Y., Spence, C.
Citation
Huang, C., Smith, L. C., Kyzivat, E. D., Fayne, J. V., Ming, Y., Spence, C. (2022). Tracking transient boreal wetland inundation with Sentinel-1 SAR: Peace-Athabasca Delta, Alberta and Yukon Flats, Alaska. In GIScience & Remote Sensing, Volume 59, Issue 1. Informa UK Limited. (1767-1792). https://doi.org/10.1080/15481603.2022.2134620
Project
GWF-AWF: Agricultural Water Futures|
PublicationType
Journal Article
Year
2022
277 / 292
Publication 1.0
T-2022-12-03-51gn0nr7GLki8w7UjsyiPpg
Abstract
Microflow cytometers and many other miniaturized microfluidic devices have shown great potential in many fields, such as, particle detection, cell sorting and classification. A reliable signal analysis method is required to improve the measurement accuracy of the emerging microfluidic devices. In this paper, a novel method is presented to analyze the signal from microspheres with different diameters based on transit time and amplitude. Experimental results show that transit time threshold plays a more important role at lower flow rate for particle differentiation and can be used to improve the performance of a microflow cytometer.
Authorship
Zhang, Y., Xu, C. Q.
Citation
Zhang, Y., Xu, C. Q. (2020) The impact of transit time on a microflow cytometer for particle classification. 2020 Photonics North (PN), pp. 1-1, https://doi.org/10.1109/PN50013.2020.9167024.
Project
GWF-SSSWQM: Sensors and Sensing Systems for Water Quality Monitoring|
PublicationType
Journal Article
Title
Transit time and amplitude thresholds in a microflow cytometer for particle classification
Year
2020
278 / 292
Publication 1.0
T-2023-01-04-n1n2yPAecYeEWAIFxIn3IYGsA
Abstract
Microflow cytometers and many other miniaturized microfluidic devices have shown great potential in many fields, such as, particle detection, cell sorting and classification. A reliable signal analysis method is required to improve the measurement accuracy of the emerging microfluidic devices. In this paper, a novel method is presented to analyze the signal from microspheres with different diameters based on transit time and amplitude. Experimental results show that transit time threshold plays a more important role at lower flow rate for particle differentiation and can be used to improve the performance of a microflow cytometer.
Authorship
Zhang, Y., Xu, C. Q.
Citation
Zhang, Y., Xu, C. Q. (2020) The impact of transit time on a microflow cytometer for particle classification. 2020 Photonics North (PN), pp. 1-1, https://doi.org/10.1109/PN50013.2020.9167024.
Project
GWF-SSSWQM: Sensors and Sensing Systems for Water Quality Monitoring|
PublicationType
Conference Presentation
Title
Transit time and amplitude thresholds in a microflow cytometer for particle classification
Year
2020
279 / 292
Publication 1.0
T-2024-02-23-h1vecEvHyjEOh1kwRjh1AGNGg
Abstract
Accurate classification of the phase of precipitation has important implications for understanding the vulnerability of future water resources in warming cold regions, where a substantial shift from snow to rain fraction is expected to occur over this century. In hydrological models, precipitation is typically partitioned into rainfall and snowfall using empirical near-surface air temperature thresholds methods. Surface air temperature methods require site-specific calibration and lack the physical basis to simulate this partitioning realistically and confidently for future climates. Advanced algorithms using the psychrometric energy balance of falling hydrometeors have demonstrated a solid physical basis and appear scalable across time and space but have only been applied in small basin studies.
This study evaluated the impact of the choice of precipitation phase prediction technique on the historical and future hydrology of the 406,000 km2 Saskatchewan River Basin (SRB), from its he ...
Authorship
Yassin, F., Pomeroy, J. W., Pietroniro, A., Davison, B.
Citation
Yassin, F., Pomeroy, J. W., Pietroniro, A., Davison, B. (2022) Uncertainty Due to Precipitation Phase Estimation Methods of Large-Scale Hydrological Predictions Under Climate Change. American Geophysical Union (AGU) Fall Meeting, December 12-16, 2022, Chicago, USA. https://agu.confex.com/agu/fm22/meetingapp.cgi/Paper/1166923
Project
GWF-MWF: Mountain Water Futures|
PublicationType
Conference Presentation
Year
2022
280 / 292
Publication 1.0
T-2025-08-20-L1C3AueIupkq9dKGucXpUQA
Abstract
This article presents a method to improve the usability of lake ice cover (LIC) maps generated from moderate resolution imaging spectroradiometer (MODIS) top-of-atmosphere reflectance data by providing estimates of aleatoric and epistemic uncertainty. We used a random forest (RF) classifier, which has been shown to have superior performance in classifying lake ice, open water, and clouds, to generate daily LIC maps with inherent (aleatoric) and model (epistemic) uncertainties. RF allows for the learning of different hypotheses (trees), producing diverse predictions that can be utilized to quantify aleatoric and epistemic uncertainty. We use a decomposition of Shannon entropy to quantify these uncertainties and apply pixel-based uncertainty estimation. Our results show that using uncertainty values to reject the classification of uncertain pixels significantly improves recall and precision. The method presented herein is under consideration for integration into the processing chain impl ...
Authorship
Saberi, N., Shaker, M. H., Duguay, C. R., Scott, K. A., and Hüllermeier, E.
Project
GWF-TSTSW: Transformative Sensor Technologies and Smart Watersheds|
PublicationType
Journal Article
Title
Uncertainty Estimation of Lake Ice Cover Maps From a Random Forest Classifier Using MODIS TOA Reflectance Data
Year
2024
281 / 292
Publication 1.0
T-2025-09-18-N1npN2ss9j60qQTHN2LGZwXWA
Abstract
This article presents a method to improve the usability of lake ice cover (LIC) maps generated from moderate resolution imaging spectroradiometer (MODIS) top-of-atmosphere reflectance data by providing estimates of aleatoric and epistemic uncertainty. We used a random forest (RF) classifier, which has been shown to have superior performance in classifying lake ice, open water, and clouds, to generate daily LIC maps with inherent (aleatoric) and model (epistemic) uncertainties. RF allows for the learning of different hypotheses (trees), producing diverse predictions that can be utilized to quantify aleatoric and epistemic uncertainty. We use a decomposition of Shannon entropy to quantify these uncertainties and apply pixel-based uncertainty estimation. Our results show that using uncertainty values to reject the classification of uncertain pixels significantly improves recall and precision. The method presented herein is under consideration for integration into the processing chain impl ...
Authorship
Saberi, N., Shaker, M. H., Duguay, C. R., Scott. K. A., and Hüllermeier, E.
PublicationType
Journal Article
Title
Uncertainty Estimation of Lake Ice Cover Maps From a Random Forest Classifier Using MODIS TOA Reflectance Data
Year
2024
282 / 292
Publication 1.0
T-2022-04-24-m1hbH6fohikOEWb957eDYrA
Abstract
Lake ice coverage products are a requirement identified by the climate community for improving numerical weather prediction and atmospheric reanalysis products, as well as for climate monitoring as determined by the Global Climate Observing System (GCOS). There are many suitable sources of observations available for mapping and monitoring lake ice coverage such as optical satellite data with the most practical ones from the Moderate Resolution Imaging Spectroradiometer (MODIS) over the last two decades. Considering the limitation of the presence of cloud cover and daylight dependency to capture imagery by optical sensors, the high revisit time of NASA’s Terra and Aqua satellites that carry MODIS allows for the production of lake ice maps required for operational and research-based projects.
Building on our previous research findings concluded from a GWF-supported project on lake ice cover mapping of Lake Erie from RADARSAT data, we are proposing a method to characterize inherent unce ...
Authorship
Saberi Nastaran, Duguay Claude, Scott Andrea
Citation
Nastaran Saberi, Claude Duguay, Andrea Scott (2022). Uncertainty estimations for mapping lake ice using random forest on MODIS TOA reflectance data. Proceedings of the GWF Annual Open Science Meeting, May 16-18, 2022.
Project
GWF-CORE: Core Modelling and Forecasting|GWF-TSTSW: Transformative Sensor Technologies and Smart Watersheds|
PublicationType
Conference Poster
Year
2022
283 / 292
Publication 1.0
T-2023-01-11-d14d3rO0Nra0KNgL6d39XDKNQ
Authorship
Cavaliere, E., Baulch, H., Basu, N., Wolfe, J., Hoggarth, C., & Hergott, A.
Citation
Cavaliere, E., Baulch, H., Basu, N., Wolfe, J., Hoggarth, C., & Hergott, A. (2019). Understanding nutrient retention in prairie wetlands using catchment classes and nutrient regimes. Global Water Futures Annual Science Meeting. Saskatoon, SK Canada. May 15-17, 2019 Conference Poster
PublicationType
Conference Poster
Title
Understanding nutrient retention in prairie wetlands using catchment classes and nutrient regimes
Year
2019
284 / 292
Publication 1.0
T-2024-12-20-m1im3QhfbgekOydWlCu0qwDQ
Abstract
Discontinuous permafrost regions are experiencing a change in land cover distribution as a result of permafrost thaw. In wetlands interspersed with discontinuous permafrost, climate change is particularly problematic because temperature increases can result in significant permafrost thaw, thaw-driven landscape changes, and resultant changes in watershed hydrologic responses. The influence of land cover change on the short- and long-term hydrological responses of wetland-peatland complexes is poorly understood. A better understanding of the impacts of climate-related land cover evolution on the hydrology of wetland-covered watersheds requires information about the distribution of hydrologically important lands, their pattern, and the rate at which they change over time. Here, we first developed a machine learning-based land cover evolution model (TSLCM) to estimate the long-term evolution of dominant land covers for application to the discontinuous permafrost regions of Northern Canada. ...
Authorship
Akbarpour, Shaghayegh
Citation
Akbarpour, Shaghayegh (2023) Using Machine Learning to Understand the Hydrologic Impacts of Permafrost Thaw-Driven Land Cover Change, UWSpace - Theses, http://hdl.handle.net/10012/19322
PublicationType
Thesis
Year
2023
285 / 292
Publication 1.0
T-2023-01-04-91npW7HFeS06v892qqbZS3Hw
Abstract
After oil spills occur, regulators require adequate information to select best practices to minimize impacts on environments and to remediate target freshwater ecosystems. Zooplankton are valuable indicators of structure and function of aquatic ecosystems since they play pivotal roles in biochemical cycles while stabilizing food webs. Traditional identification of zooplankton can be costly and time-consuming, while also being difficult to standardize. Compared with classification of individuals by identification, based on visual inspection of morphology, metabarcoding of DNA and or RNA has promise for cost-effective high-throughput and benchmarkable biomonitoring of zooplankton communities. These identification methods were applied in the context of assessing responses of the zooplankton community exposed to simulated spills of diluted bitumen (dilbit), with concurrent exposure of experimental remediation practices of enhanced monitored natural recovery and shoreline cleaner applicatio ...
Authorship
Ankley, Phillip J
Citation
Ankley, Phillip J 2021. Using zooplankton metabarcoding for the ecotoxicological assessment of remediation practices for a simulated petroleum spill in a boreal lake.
Project
GWF-NGS: Next Generation Solutions for Healthy Water Resources|
PublicationType
Thesis
Year
2021
286 / 292
Publication 1.0
T-2023-03-22-H1jtGv4DOjUCas4swdXu8ag
Abstract
Space-based, global-extent digital elevation models (DEMs) are key inputs to many Earth sciences applications. However, many of these applications require the use of a ‘bare-earth’ DEM versus a digital surface model (DSM), the latter of which may include systematic positive biases due to tree canopies in forested areas. Critical topographic features may be obscured by these biases. Vegetation-free datasets have been created by using statistical relationships and machine learning to train on local-scale datasets (e.g., lidar) to debias the global-extent datasets. Recent advances in satellite platforms coupled with an increased availability of computational resources and lidar reference products has allowed for a new generation of vegetation- and urban-canopy removals. One of these is the Forest And Buildings removed Copernicus DEM (FABDEM), based on the most recent and most accurate global DSM Copernicus-30. Amongst the more challenging landscapes to quantify surface elevations are dens ...
Authorship
Marsh C.B., Harder P., Pomeroy J.W.
Citation
Marsh C.B., Harder P., Pomeroy J.W. (2023). Validation of FABDEM, a global bare-earth elevation model, againstUAV-lidar derived elevation in a complex forested mountain catchment. Environmental Research Communications.
Project
GWF-MWF: Mountain Water Futures|GWF-IMPC: Integrated Modelling Program for Canada|
PublicationType
Journal Article
Year
2023
287 / 292
Publication 1.0
T-2023-01-11-J1epcreMttE6vHMcchx2XbQ
Authorship
Ogden, Emily
Citation
Ogden Emily. Variation among land classification units in the NWT. Thesis
Project
GWF-NWF: Northern Water Futures|
PublicationType
Thesis
Title
Variation among land classification units in the NWT
Year
2021
288 / 292
Publication 1.0
T-2023-01-04-d1ZDOfDHQhUqGJd1Yx2Uys2g
Abstract
Peatlands in the Rocky Mountains most commonly occur in valley bottoms and are classified as fens. Understanding how fens influence water storage and water release is essential for better predicting water availability as the climate changes. Peatlands located in mountain regions tend to have a complex soil profile due to the geomorphologically dynamic environment. There is little information on the water storage capacity of mountain peatlands. To address this knowledge gap, the water storage capacity of a fen peatland with a complex soil profile in the Canadian Rocky Mountains, Alberta, Canada, was studied. Using the water table fluctuation method, vertical variations in specific yield were estimated. The influence of several factors – soil profile complexity, vegetation cover, water table depth, and seasonality – on specific yield were determined. Results showed that soil profile complexity plays a vital role in determining the spatial variability of vertical specific yield. The effec ...
Authorship
Schut, Selena.
Citation
Schut, Selena. 2021. Variations in water storage capacity of a mountain peatland with complex stratigraphy. MSc Thesis, University of Saskatchewan. https://harvest.UofS.ca/handle/10388/13679
Project
GWF-MWF: Mountain Water Futures|
PublicationType
Thesis
Year
2021
289 / 292
Publication 1.0
T-2024-04-03-l1otJSl27vdESaW5cvtl3WqAw
Abstract
Flow management has the potential to significantly affect ecosystem condition. Shallow lakes in arid regions are especially susceptible to flow management changes, which can have important implications for the formation of cyanobacterial blooms. Here, we reveal water quality shifts associated with changing source water inflow management. Using in situ monitoring data, we studied a seven-year time span during which inflows to a shallow, eutrophic drinking water reservoir transitioned from primarily natural landscape runoff (2014–2015) to managed flows from a larger upstream reservoir (Lake Diefenbaker; 2016–2020) and identified significant changes in cyanobacteria (as phycocyanin) using generalized additive models to classify cyanobacterial bloom formation. We then connected changes in water source with shifts in chemistry and the occurrence of cyanobacterial blooms using principal components analysis. Phycocyanin was greater in years with managed reservoir inflow from a mesotrophic ups ...
Authorship
Baron, A.
Citation
Baron, A. (2023) Water source, climate, and water chemistry combine to influence DOC concentration and DOM quality in Buffalo Pound Lake, Saskatchewan.
Project
GWF-PW: Prairie Water|GWF-FORMBLOOM: Forecasting Tools and Mitigation Options for Diverse Bloom-Affected Lakes|
PublicationType
Thesis
Year
2023
290 / 292
Publication 1.0
T-2024-12-20-D1flAjbeXUk69uwFzYZz2oA
Authorship
Hassan, Amina
Citation
Hassan, Amina (2024) Watershed Classification in the Great Lakes Basin: Implications for Water Quality and Agricultural Management Practices, UWSpace - Theses, https://hdl.handle.net/10012/20623
PublicationType
Thesis
Title
Watershed Classification in the Great Lakes Basin: Implications for Water Quality and Agricultural Management Practices
Year
2024
291 / 292
Publication 1.0
T-2021-11-14-61ZtAWobmMkuMhedSgiYqCA
Abstract
Wetlands around the world are increasingly impacted by a shift in environmental conditions due to climate change, land use development, resource extraction, urbanization, and sea level rise, to name a few external pressures (Meng et al., 2016; Walpole and Davidson, 2018). These environmental changes can alter the hydrological regime, impacting the biogeochemical processes that govern important wetland ecosystem services, such as carbon sequestration and water storage. Biogeochemical processes in wetlands are highly dynamic (Reddy et al., 2010; Jackson et al., 2014) and involve complex interactions between hydrological processes, mineralogical transformations, bacterial and vegetation communities, and soil stores of carbon and nutrients (Cherry, 2011; U.S. EPA, 2015). Currently, our understanding of biogeochemical properties of wetlands are derived from mechanistic and statistical links between biological, geological, and chemical processes. However, how climatic and hydrological proces ...
Authorship
Rezanezhad, F., McCarter, C. P., & Lennartz, B.
Citation
Rezanezhad, F., McCarter, C. P., & Lennartz, B. (2020). Wetland Biogeochemistry: Response to Environmental Change. Frontiers in Environmental Science, 8, 55. https://doi.org/10.3389/fenvs.2020.00055
Project
GWF-WSPT: Winter Soil Processes in Transition|
PublicationType
Journal Article
Year
2020
292 / 292
Publication 1.0
T-2022-12-05-l1Sl1Ou3l2a4k6UNUO1N6j46A
Abstract
High-latitude forests of North America are characterized by their natural dependence on large and severe wildfires. However, these wildfires also pose a range of social, economic, and environmental risks, with growing concern regarding persistent effects on stream flow volume, seasonal timing of flow, water quality, aquatic ecosystem health, and downstream community drinking water treatment. Here, we present the outcomes of a comprehensive scoping review of post-fire hydrologic studies in high-latitude forests of North America (Canada and Alaska). Our objectives were to (1) create an inventory of studies on post-fire hydrologic effects on surface water; (2) analyze those studies in terms of watershed characteristics and the type and duration of hydrologic effects; (3) identify and evaluate the link between upstream hydrologic effects with hydrologic ecosystem services; and (4) propose a research agenda addressing the link between wildfire science and hydrologic ecosystem services. We s ...
Authorship
Robinne, F. N., Hallema, D. W., Bladon, K. D., & Buttle, J. M.
Citation
Robinne, F. N., Hallema, D. W., Bladon, K. D., & Buttle, J. M. (2020). Wildfire impacts on hydrologic ecosystem services in North American high-latitude forests: A scoping review. Journal of Hydrology, 581, 124360. https://doi.org/10.1016/J.JHYDROL.2019.124360
PublicationType
Journal Article
Year
2020