
Related items loading ...
Section 1: Publication
Publication Type
Thesis
Authorship
Hunter, Anders
Title
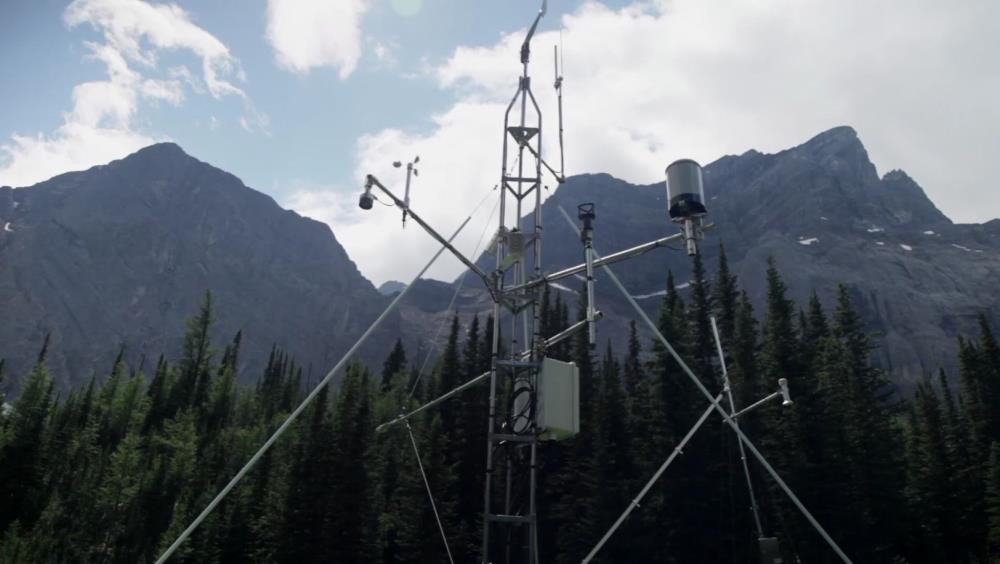
Mapping evapotranspiration to disaggregate eddy-covariance footprints
Year
2022
Publication Outlet
USASK Harvest - Theses and Dissertations
DOI
ISBN
ISSN
Citation
Abstract
Land-atmosphere interactions are commonly quantified using eddy-covariance (EC) equipment. This technique provides fluxes which are attributed to an area-averaged two-dimensional flux footprint. Although source flux heterogeneity is present within these footprints, current EC footprint models are unable to distinguish the variable flux contributions (although they are incorporated into the bulk EC flux). A disaggregation method would increase the value of EC data by allowing users to isolate individual fluxes from features within the flux footprint; furthermore, this may extend the useability of the EC method to more complex terrain of mixed land classifications. It remains unexplored how high-resolution surface energy balance (SEB) models can be used to disaggregate these EC footprints. This thesis presents a SEB workflow using Unoccupied Aerial Vehicles (UAVs) to generate high-resolution patterns of evapotranspiration (ET) to disaggregate EC footprints in a novel disaggregated flux footprint prediction (disFFP) method. This workflow begins by using novel UAV Light Ranging And Detection (LiDAR) techniques to derive detailed maps of canopy height (h), effective leaf area index (LAI_e), and canopy viewing fraction (f_c), consistent with known vegetation patterns and field-average observations (LAI_e RMSE=0.08-0.81 m^2 m^(-2)). It then follows an atmospheric correction (path transmissivity and upward-welling radiance) and an ensemble emissivity adjustment (brightness to radiometric temperature), testing these with UAV thermal data to determine their absolute (magnitude) and relative (spatial pattern) effects on temperature. A modified t-test - considering autocorrelation - showed that a raw brightness temperature has similar spatial patterns (r>.99, p_val≫0.001) to brightness and radiometric temperatures. Combining these thermal and LiDAR UAV inputs with a high-resolution SEB model (HRMET), the model performance was then compared against EC fluxes. It followed that HRMET tended to overestimate latent heat over full canopies when surface-air temperature differences exceed 4-5°C. Overall, HRMET succeeded at replicating EC latent heat flux within RMSE of 79-136 W m^(-2) using raw brightness and ensemble emissivity corrected (observed radiometric) temperatures. The resultant relative ET maps (ET_R) provided a coherent chronology of the changing flux landscape. Furthermore, the ET_R trials using corrected temperatures (brightness, radiometric, and observed radiometric) had similar spatial patterns to those found using just raw brightness temperature (r>.93, p_val≫0.001). This implies that a raw brightness temperature is sufficient for determining relative patterns of evapotranspiration. The next part of the workflow uses ET_R to disaggregate a well-known parameterization of a backwards-Lagrangian flux footprint model. The proposed disaggregation method (disFFP) uses the concept of ET period to describe an interval of time (day scale) where the EC flux environment remains relatively constant (constant-rate cumulative ET rate). ET periods were determined using a piece-wise regression of the cumulative day-over-day EC latent flux rate. Each season was divided into five ET periods and compared with the two other seasons to discover potential metrics for further classifying ET periods. It was found that ET rates were consistent across comparable ET periods, 2-38 % (standard deviation as a percentage of sample mean), and that additional metrics (plant phenology, growing degree day, standard precipitation index) played an important role in characterizing ET periods for inter-seasonal work. Eddy-covariance and UAV data were coupled using climatology footprints of ET periods and the coinciding ET patterns (ET_R and coefficient of variation). The disFFP combination of these two products (footprint-weighted factoring) provided disaggregated footprints (EC bulk ET of 144 mm) that reflected increased contributions (180-200 mm) over high ET areas and diminished values (90-100 mm) over lower ET areas. These preliminary findings present an exciting new opportunity to connect discrete UAV data with continuous EC flux monitoring.
Plain Language Summary
 Metadata Editor
 Record List
 Alias List Editor
 Legacy sites

 GWFNet
 Master
 Research
 Map
Map
 Advanced
 Tools
Tools
 . . .
. . .